grey water footprint

Comparison of the Grey Water Footprint of Conventional Pollution and Micropollutants: A Case Study of the Bandung WWTP (Indonesia)

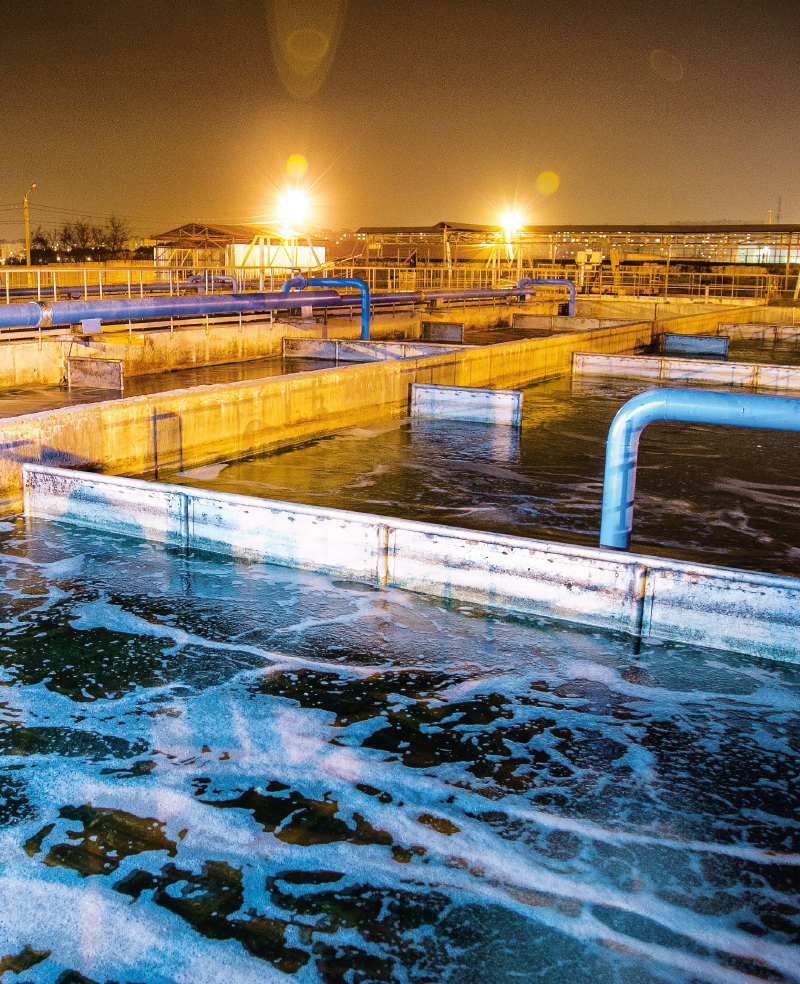
Grey water footprint refers to the amount of water required to dilute pollutants released into the aquatic environment so that the water quality remains above agreed water quality standards. This study examines the grey water footprint of micropollutants, also referred to as contaminants of emerging concern (CECs), compared to commonly monitored water parameters (such as nutrients and organic pollution) in wastewater. 24-hour samples were analysed from Indonesia’s largest WWTP, which uses a stabilization pond system for wastewater treatment. The grey water footprint was calculated for 12 micropollutants and six parameters of standard chemical monitoring. The highest value of the grey water footprint in the WWTP effluent was for BOD5 (13.5 l/l). The highest value among the micropollutants in the WWTP effluent was for Fluoxetine (0.08 l/l). When using other published PNEC values, Fluoxetine reached higher grey water footprint values than BOD5. The highest value of the grey water footprint in the WWTP influent was for Ibuprofen (210.4 l/l), but this substance was effectively removed in the WWTP.
Emerging contaminants in wastewater – results of Joint Danube Survey 4 evaluated via the grey water footprint

The Joint Danube Survey (JDS4), organized in 2019, provided a unique dataset on the occurrence of several hundred newly identified contaminants of emerging concern (CEC) in waters of the Danube river basin, including wastewater from selected wastewater treatment plants. In this study, published JDS4 data were used to assess the significance of individual substances identified in wastewater using the grey water footprint approach. Determining all newly identified contaminants is time-consuming and expensive, so it is reasonable to focus on the „most problematic“ substances. The advantage of the grey water footprint assessment is conversion of the amount of discharged pollutants into the volume of water needed for dilution to an environmentally ‘safe level’, allowing comparison of different substances. Based on JDS4 data, out of several hundreds of substances detected, 33 were identified as potentially risky, according to set criteria. However, this list cannot be taken as definitive, as the level of knowledge about the harmfulness of individual substances quickly develops with regard to the risk currently attributed to them. Similarly, the JDS4 dataset reflects a specific data collection methodology, which may not capture all connections related to the impact of the occurrence of new substances on the environment.

The history of the grey water footprint, or let’s quote the originator of the idea

The water footprint was introduced in 2002 [1] and quickly became a popular tool for assessing anthropogenic impacts associated with human activities. The basic methodological document that describes the water footprint methodology is the Water Footprint Assessment Manual from 2011 [2]. The water footprint consists of three components, depending on the source and type of water use: 1) the blue water footprint represents water consumption from water sources, i.e. taken from rivers, lakes, and aquifers, 2) the green water footprint represents the consumption of water that comes from precipitation and is stored on the surface of the soil or plants or as soil moisture, and is consumed mainly by evapotranspiration, 3) the grey water footprint represents the amount of water needed to assimilate anthropogenic pollution based on the natural background concentration and existing environmental water quality standards.

Grey water footprint of pollution discharged from wastewater treatment plants in the Czech Republic registered in the water balance in the period 2002–2018 – data set

Koncept vodní stopy byl představen v roce 2002 [1] a dnes je jedním z rozšířených nástrojů pro hodnocení udržitelnosti užívání vodních zdrojů [2]. Vodní stopa patří do rodiny environmentálních stop [3], které umožňují podívat se na problémy užívání přírodních zdrojů z jiné perspektivy. Šedá vodní stopa je kvalitativní ukazatel převádějící vypouštěné znečištění na objem vody potřebný k jeho naředění na koncentrace neškodné pro životní prostředí [4].