SUMMARY
The aim of this study was to objectively evaluate the applicability of VNIR spectroscopy (spectroscopy in the visible and near-infrared region of the electromagnetic spectrum) for the prediction of forest soil properties. The most appropriate combinations of statistical pre-processing (no pre-processing, continuum removal, 1st and 2nd derivative) and processing (PLSR – partial least squares regression, PCR – principal component regression, SVM – support vector machines) methods in specific spectral bands were sought for each soil property. The combination of the 1st derivative and SVM methods proved to be generally the most successful in the whole VNIR spectral band (400–2500 nm). However, in some cases (different forms of magnesium, manganese, iron, or aluminium) other models have proved to be successful. The best predictable properties (R2 > 0.6) include soil pH, oxidizable carbon content, and the contents of aluminium, iron, silicon, or calcium (at higher concentrations). Not very high prediction success (R2 < 0.3) was found for parameters that take on low values (the content of sodium, manganese, or divalent aluminium complexes). The results show that VNIR spectroscopy is a useful method for the prediction of forest soil properties. It cannot completely replace classical analysis, but it can complement it very well, especially in practice. For example, it can help to thicken the data network in soil mapping and refine the information better than other spatial estimation methods. It can be used in cases where a significant amount of data is needed in a short time frame and at minimum cost. It is suitable for monitoring trends over time or for rapid exploration of an area.
INTRODUCTION
Information on soil properties is required for a variety of purposes, such as precision agriculture or forestry, soil quality assessment, soil mapping or soil conservation. It is necessary to collect a large amount of analytical data within soil examination. The collection and subsequent analysis of soil samples using traditional methods is time consuming and costly [1, 2]. Therefore, indirect measurements and predictions of soil properties using mathematical models are increasingly being used. Several studies have shown that spectroscopy in the visible (VIS) and near-infrared (NIR) region of the electromagnetic spectrum is a suitable method for assessing soil properties. The models published so far are not universal and are only relevant under specific conditions and for certain soil groups. This study aims at assessing the applicability of spectroscopy in the evaluation of properties of forest soils in the Czech Republic based on the relationships between spectral features and soil properties determined by traditional laboratory methods. More than 4,500 samples taken from whole soil profiles were used for this assessment. Appropriate combinations of data preparation methods (1st and 2nd derivatives [3], continuum removal) and statistical techniques of partial least squares regression (PLSR), support vector machines (SVM) and principal component regression (PCR) were tested to develop predictive models.
THE METHODS
The study was carried out using 4,680 samples taken from whole soil profiles using a soil probe or from excavated soil material. Some of the soil samples were obtained from the Department of Soil Science and Soil Protection at the Czech University of Life Sciences in Prague, the rest were borrowed from other departments. The sampling sites were chosen to cover the whole territory of the Czech Republic and to include different forest soil types. The sampling sites were located at different altitudes and in forests with different species composition. The study did not deal with field measurements; only dried samples treated to fine soil I (particle size < 2 mm) were used [4]. This eliminated the influence of soil moisture, which is essential on the spectral curves and hinders the field application of the method to a great extent. Selected analyses were performed with soil samples using conventional methods (Tab. 1).
Tab. 1. Used methods of conventional analysis

The spectra were measured in samples treated to fine soil I in Petri dishes using a FieldSpec 3 spectrometer (ASD Inc., USA) with a High Intensity Contact Probe (Fig. 1). The range of the spectrometer is 350–2,500 nm.
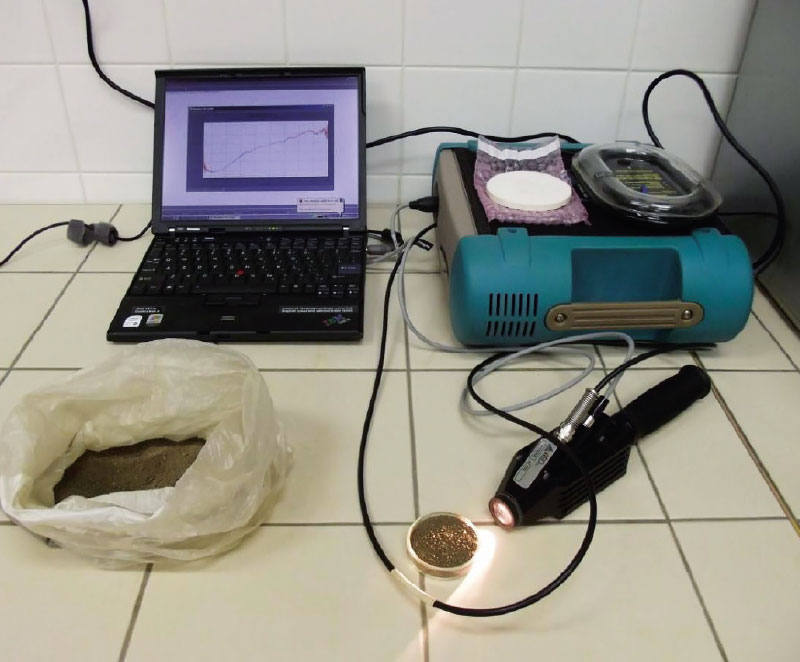
Fig. 1. FieldSpec 3 spectrometer (photo: Josef Kratina)
The program Statistica 12 (StatSoft) was used to determine basic statistical descriptive characteristics. The program ViewSpec Pro 6.0 (ASD Inc.) was used to pre-process the spectral data, namely, to smooth the spectral curves (splice correction). The R program (R Core Team) was used to adjust the spectra using continuum removal. The programs Unscrambler X 10.3 (CAMO Software) and R (R Core Team) were used for their calibration (partial least squares regression, support vector machines, principal components regression).
The relationship between spectral features and soil properties, which were obtained using traditional laboratory methods, was evaluated statistically. The appropriateness of using different data preparation methods such as 1st and 2nd derivative or continuum removal (unification of spectral curves obtained with different instruments or under different light conditions) was tested. Published models for predicting soil characteristics from spectral features were tested, their parameters were adjusted, or new models were created using statistical methods of PLSR, PCR and SVM. For the statistical evaluation, not only all the data were used together, but they were also divided into subsets by sampling area and by horizon to describe the most appropriate data entry method for successful prediction. The effect of the spectral band used on the success of the prediction was also tested. Some properties are better predicted using the entire VNIR spectrum, while for others it is more appropriate to use only a selected spectral band, which is chosen either experimentally or based on the literature [14–17].
The new models have been validated. The reported predictions, expressed in terms of R2 (coefficient of determination) and RMSE (root mean square error) values, are the result of the cross validation process in which the data set is divided into several subsets, one (10% of the whole) is removed and the remaining ones are used for model calibration. The model is then applied to the previously removed set, the values predicted by the model are compared with those measured in the laboratory. This is repeated for all subsets. The R2 and RMSE parameters are then calculated. The model was calibrated for the groups formed in this way. Subsequently, the new models were subjected to external validation, in which the model was applied to a different data set and the success of the prediction was determined.
The spectra were measured in samples treated to fine soil I in Petri dishes using a FieldSpec 3 spectrometer (ASD Inc., USA) with a High Intensity Contact Probe (Fig. 1). The range of the spectrometer is 350–2,500 nm.
The program Statistica 12 (StatSoft) was used to determine basic statistical descriptive characteristics. The program ViewSpec Pro 6.0 (ASD Inc.) was used to pre-process the spectral data, namely, to smooth the spectral curves (splice correction). The R program (R Core Team) was used to adjust the spectra using continuum removal. The programs Unscrambler X 10.3 (CAMO Software) and R (R Core Team) were used for their calibration (partial least squares regression, support vector machines, principal components regression).
The relationship between spectral features and soil properties, which were obtained using traditional laboratory methods, was evaluated statistically. The appropriateness of using different data preparation methods such as 1st and 2nd derivative or continuum removal (unification of spectral curves obtained with different instruments or under different light conditions) was tested. Published models for predicting soil characteristics from spectral features were tested, their parameters were adjusted, or new models were created using statistical methods of PLSR, PCR and SVM. For the statistical evaluation, not only all the data were used together, but they were also divided into subsets by sampling area and by horizon to describe the most appropriate data entry method for successful prediction. The effect of the spectral band used on the success of the prediction was also tested. Some properties are better predicted using the entire VNIR spectrum, while for others it is more appropriate to use only a selected spectral band, which is chosen either experimentally or based on the literature [14–17].
The new models have been validated. The reported predictions, expressed in terms of R2 (coefficient of determination) and RMSE (root mean square error) values, are the result of the cross validation process in which the data set is divided into several subsets, one (10% of the whole) is removed and the remaining ones are used for model calibration. The model is then applied to the previously removed set, the values predicted by the model are compared with those measured in the laboratory. This is repeated for all subsets. The R2 and RMSE parameters are then calculated. The model was calibrated for the groups formed in this way. Subsequently, the new models were subjected to external validation, in which the model was applied to a different data set and the success of the prediction was determined.
RESULTS AND DISCUSSION
Success of a method in predicting soil properties is highly dependent on the appropriate way of entering the input data, their statistical pre-processing and evaluation. The aim of this study was to find the most suitable combination of data entry method, statistical pre-processing, and spectral data processing to obtain the best results for soil property prediction.
The whole dataset and its division by horizons and regions
The first statistically evaluated dataset was the whole dataset regardless of sampling area or horizon. Spectra without pre-processing in the entire 350–2,500 nm range were used. The statistical method used was partial least squares regression (PLSR), which is often recommended in the literature. In Fig. 2, which shows all spectra together, we can see the large variability of their course. This may be due to different soil properties, e.g. different amounts of soil organic matter in the mineral and organic horizons.
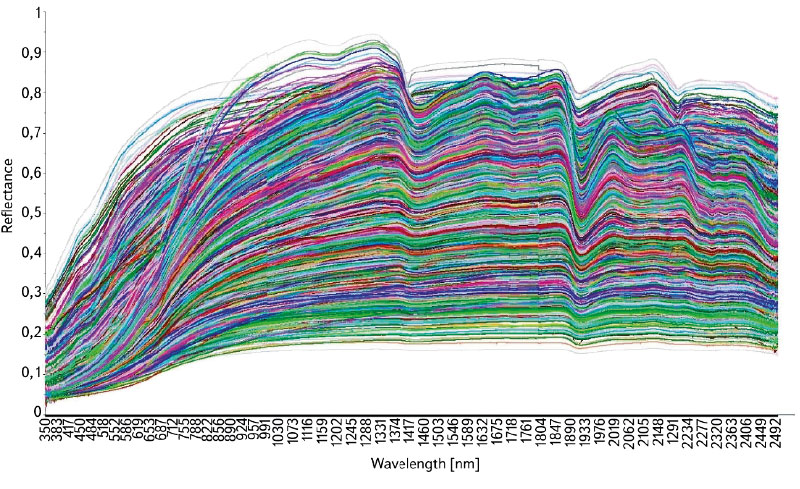
Fig. 2. Spectra representation – the summary data set
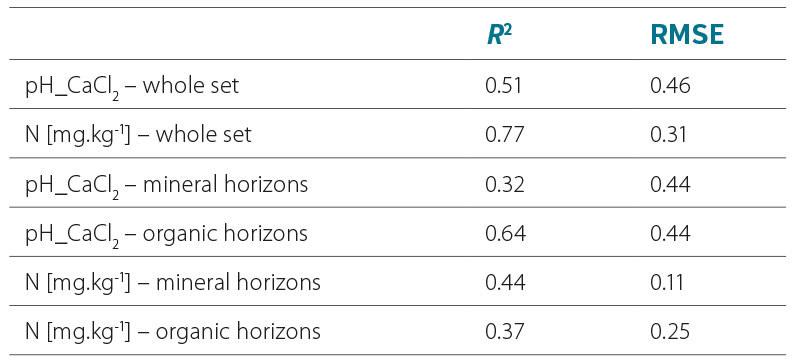
Properties common to as many measured samples as possible were sought. Specifically, it concerned the amount of oxidizable carbon – Cox, total nitrogen content and pH_CaCl2. The results seem to be very good (Cox – R2 = 0.92, nitrogen content – R2 = 0.77, pH_CaCl2 – R2 = 0.51), but their publication would only be correct in the case of the pH_CaCl2. According to the frequency distribution of the data of the individual properties, the normal distribution is only in the case of pH_CaCl2. The results for oxidizable carbon and nitrogen content form two clusters. These give a high value of the coefficient of determination when fitted through the regression line. However, the results are biased and cannot be interpreted correctly. The pH_CaCl2 prediction is more successful despite the lower value of the coefficient of determination. Since normal distribution of the data is a prerequisite for the application of PLSR, the set had to be subjected to a different statistical treatment.
Tab. 2 shows the results of the prediction of pH_CaCl2 and nitrogen content using the whole set and when it is divided into organic and mineral horizons. It can be seen from the results that, in contrast to the previous results, the whole set shows a higher R2 value, but the root mean square error (RMSE) increases along with it, although it should ideally decrease.
The preliminary results show that division of the dataset by sampling areas does not always provably increase the success rate of soil property prediction and, therefore, this data preparation method cannot be recommended unequivocally. The conclusion is more complicated when it comes to division of the data by soil horizon. In some cases, such a division appears to be more advantageous, while in other cases the prediction success rate, expressed by the coefficient of determination, is significantly better in favour of the undivided set. In such a situation, however, another variable describing the success of the prediction, the root mean square error, should be observed. The RMSE, unlike the coefficient of determination, should be decreasing, which does not happen in the above cases.
Tab. 2. Predictions according to horizons
Organic and mineral horizons are fundamentally different in nature and different properties are usually determined for them in the laboratory. If some properties are determined together for the horizons of the whole soil profile, the differences are clearly visible. The data do not have a normal distribution (it is bimodal) and the results cannot be interpreted correctly. This preliminary conclusion was further verified using the SVM method, which is not as fundamentally sensitive to the data distribution as regression (linear) methods.
Effect of the statistical method used on the success of the prediction
The data were subjected to various combinations of pre-processing (no pre-processing, 1st and 2nd derivatives, continuum removal) and statistical methods (PLSR, PCR, SVM). An example of the change in the spectral curves according to the pre-processing method used is shown in Fig. 3. The two most effective combinations were always selected for each property and they were refined individually.
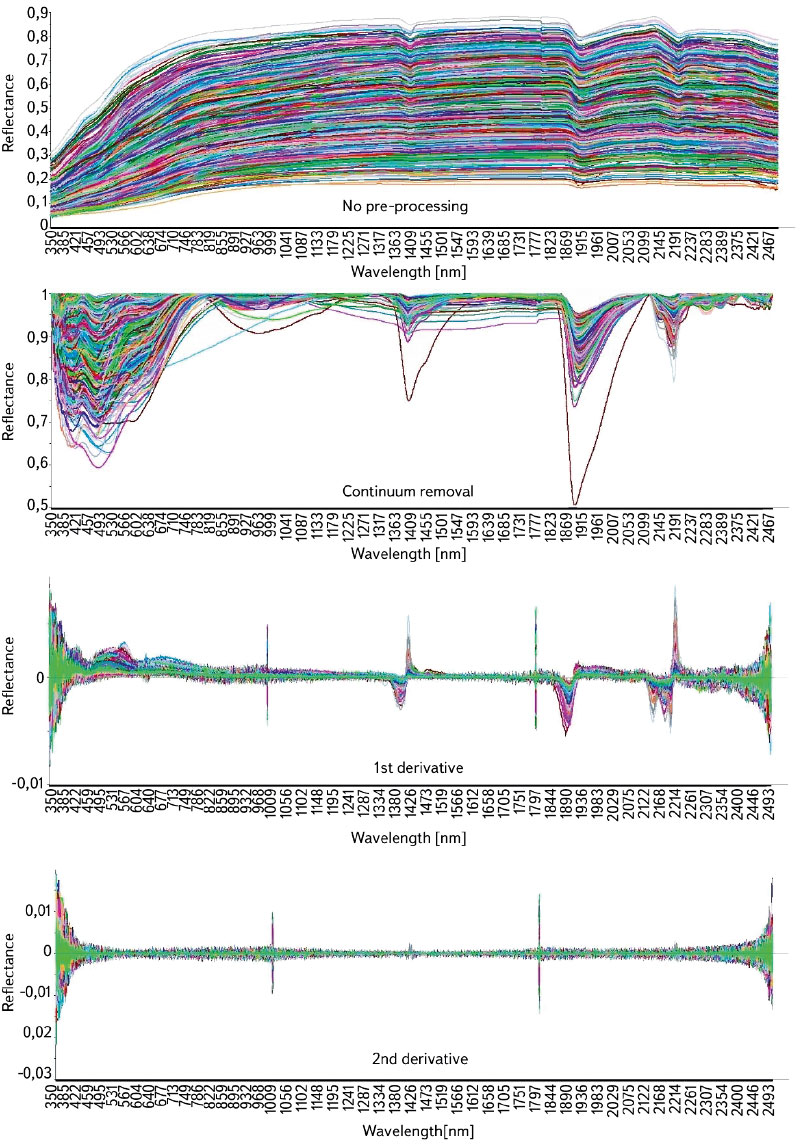
Fig. 3. The course of spectral curves – various pre-processing methods
In their paper [18], Viscarra Rossel and Behrens identified SVM and PLSR as the two most successful methods. The results of this study confirm this, especially in favour of SVM, and provide additional information by combining these methods with different pre-processing methods. In most cases, the highest prediction success was found when combining the 1st derivative of spectral data and SVM, followed by PLSR on data without pre-processing and SVM after continuum removal. Another successful combination in some cases was the use of the 2nd derivative and SVM. In contrast, regression methods applied to data pre-processed with the 2nd derivative were clearly the least successful. The regression methods of PLSR and PCR provide very similar results, mostly in slight favour of PLSR.
Prediction of individual properties
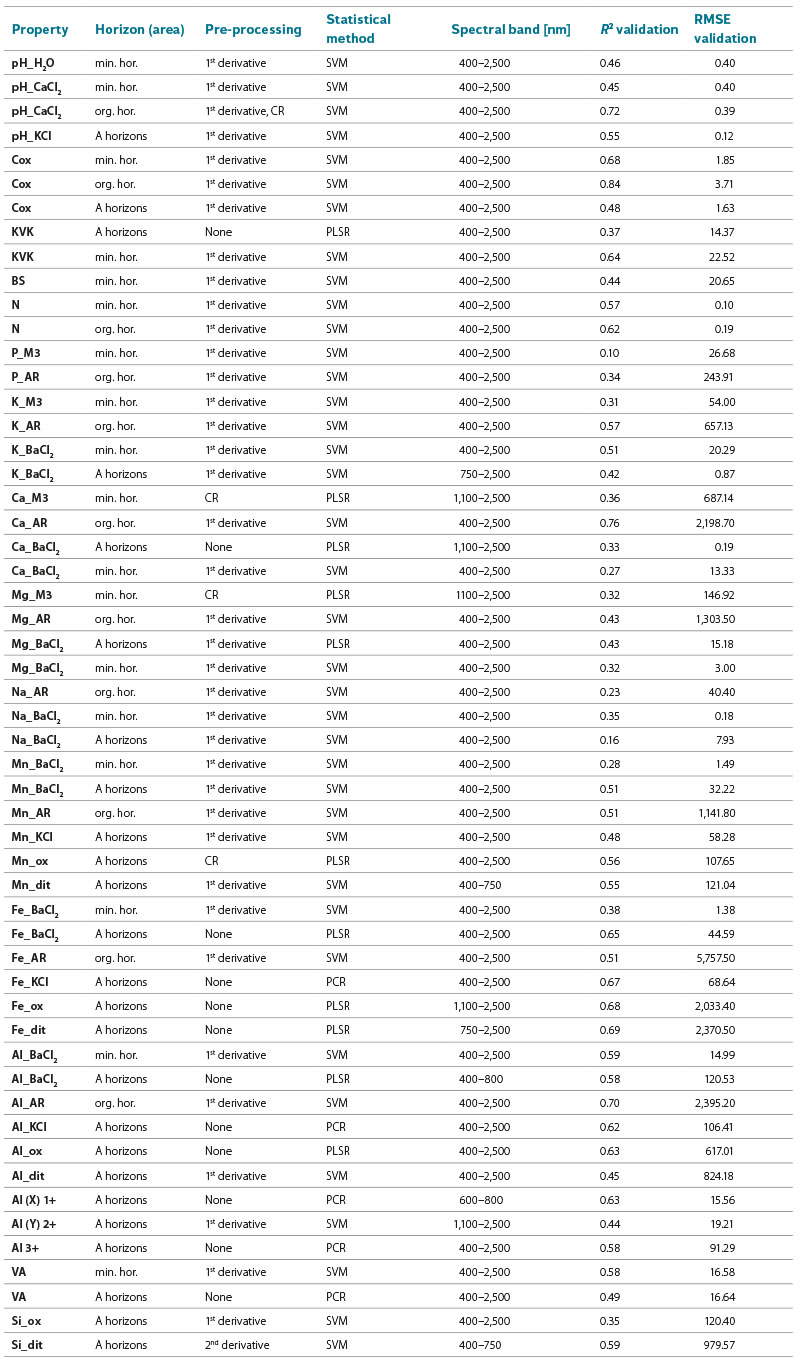
Based on the literature [14, 15, 17] and the above findings, the best combinations of the type of pre-processing used, the statistical method and, more recently, the spectral band selected were sought. For each property, the most successful combinations of methods were selected according to previous findings and subjected to further testing. The modification of the spectra by clipping the 350–400 nm band, which is significantly interfered by noise at the UV-visible interface, was common to all properties. In general, the combination of the 1st derivative spectral data pre-processing method and the support vector machine statistical method using the entire VNIR spectral band (400–2,500 nm) appears to be the best. However, there are cases where other combinations of methods and other (narrower) spectral bands have proven to be most appropriate. For example, calcium and magnesium determined in the aqua regia leachate were best predicted by the PLSR method applied to spectral data modified using the continuum removal function in the near-infrared region of the 1,100–2,500 nm spectrum. In most cases, the PLSR method (Mg, Mn, Fe, Al) instead of SVM was best for the elements determined in oxalate. The diversity of the models was particularly observed in the case of iron and aluminium prediction, i.e. for two elements that are highly monitored in forest soils. The spectral detectability of the different forms of aluminium varies considerably. The least successfully predicted divalent form, which binds to organic matter but is present in extremely small amounts, can alternatively be predicted by subtracting the content of the monovalent and trivalent complexes from the total content determined in a common leachate, in this case it is the KCl leachate. Tab. 3 shows the best models for predicting each soil property, including the validation R2 and RMSE. The set is divided by the soil horizon or group of horizons.
Tab. 3. The best predictions by method and band – summary
Testing and modification of found models
The found models were also applied to independent data sets. The prediction success rates of each property before and after the models´ application were compared. The data used as those “before model application” were subjected to standard statistical processing, i.e., the PLSR method across the whole VNIR band on the non-pre-processed spectra. The models that improved the prediction results were found to be appropriate and universal. In cases the prediction success increased very little, remained unchanged, or even decreased, other models were sought based on existing knowledge.
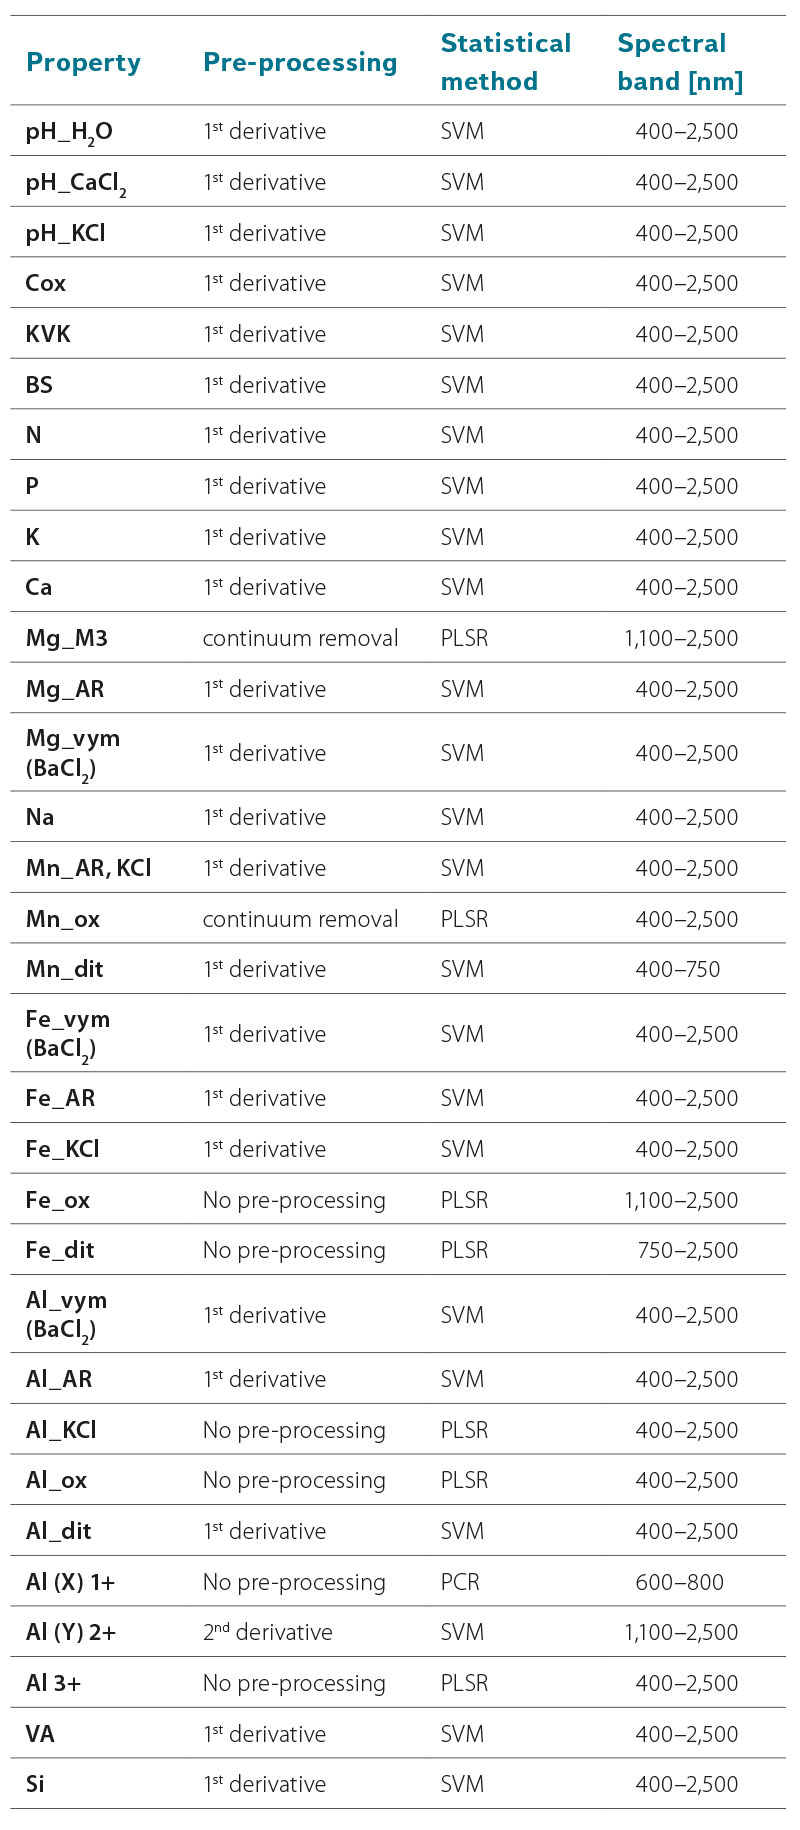
Tab. 4 shows the best models for predicting forest soil properties. In addition to the success of the prediction, emphasis was put on the versatility of the models. In case a property was determined in various ways, but the model is common to all these ways, only the given property is indicated in the table. If the determination method had an impact on the spectral detectability and therefore required the use of a different model, the properties are described individually together with the determination method.
Tab. 4. The best versatile statistical models for the prediction of individual properties
CONCLUSION
The aim of the study was to objectively evaluate the applicability of spectroscopy in the visible and near-infrared region of the spectrum for predicting forest soil properties. These soils differ fundamentally from agricultural soils in their appearance, development, physical and chemical processes, presence of organic horizons, etc. They are also usually monitored for different properties. It has been found that the division of the data set by sampling area is not a significant input criterion; the distribution of the data is more important. Due to the large differences between organic and mineral horizons, it is recommended, on the basis of the results, to examine these horizons separately.
As a large amount of data was available, it was possible to split the data into a larger training set, on which the models were trained thoroughly one by one, and a testing set, on which the models were tested and further adjusted based on the results if necessary. In this way, the most appropriate combinations of statistical pre-processing and processing methods in specific spectral bands were found for each soil property. The combination of 1st derivative and support vector machine in the whole VNIR spectral band (400–2,500 nm) is generally found to be the most successful. However, in some cases, other models have proven successful. The best predictable properties (R2 > 0.6) include soil pH, and the contents of oxidizable carbon, aluminium, iron, silicon, or calcium (at higher concentrations). Not very high prediction success (R2 < 0.3) was found for parameters that take on low values (the content of sodium, manganese, or divalent aluminium complexes).
The results show that VNIR spectroscopy is a useful method for the prediction of forest soil properties. It cannot completely replace classical analysis, but it can complement it. For example, in soil mapping, it can help to thicken the data network and refine the information better than other spatial estimation methods. It can be used in cases where large amounts of data are needed in a short time frame and at minimum cost. It is suitable for monitoring trends over time or for rapid examination of samples from an area.
Acknowledgements
The authors would like to thank the Department of Soil Science and Soil Protection at the Czech University of Life Sciences in Prague for providing technical equipment and assistance in the preparation of this study, which was carried out as part of PhD studies.
The paper has been peer-reviewed.
