ABSTRACT
The article presents the results of the assessment of the status of surface water bodies in the Czech Republic for 2019 to 2021. The status assessment has been carried out by T. G. Masaryk Water Research Institute, p. r. i. (TGM WRI), Biology Centre CAS, and the Czech Hydrometeorological Institute (CHMI). The status of the water bodies was evaluated according to monitoring data from the River Boards state enterprises and – in the case of selected priority substances in biota – from the CHMI. The assessment procedures were the same as in the previous status assessment for 2016 to 2018, which was incorporated into the river basin management plans for the third planning period. The article focuses on presenting the results of the assessment, which was prepared by the TGM WRI. It is a summary assessment of the ecological and chemical status of water bodies, an evaluation of chemical and physico-chemical indicators and a comparison of the results of the assessment for 2019 to 2021 with the assessment for 2016 to 2018. In 2019 to 2021, good chemical status was not achieved in 57.6 % of water bodies; the problematic pollutants are mainly polyaromatic hydrocarbons; in the ‘biota’ matrix there was also mercury and brominated diphenyl ether. Good ecological status/potential has not been achieved in 92.3 % of water bodies; the problematic indicators are mainly biological quality elements and phosphorus.
INTRODUCTION
The environmental goals specified by the Water Framework Directive (WFD) [1] include the achievement of good status of water bodies (or good potential of heavily modified and artificial water bodies). In the case of surface water and in the conditions of the Czech Republic, this involves achieving a good status of surface water bodies in the “river” and “lake” categories. According to the Water Act [2], status of surface water means a general status of a surface water body determined by its ecological or chemical status according to which is worse. Good chemical status of surface waters means the chemical status necessary for achieving the goals of water protection as a component of the environment, in which the concentrations of pollutants do not exceed environmental quality standards. An environmental quality standard means the concentration of a pollutant or group of pollutants in water, sediments or living organisms, which must not be exceeded for reasons of protection of human health and the environment. Ecological status means the quality of the structure and function of aquatic ecosystems linked to surface waters. Ecological status is assessed by comparing the current status with nearby natural or reference conditions. The ecological status of a water body is determined by its lowest rated quality element. Biological, hydro-morphological, chemical (specific pollutants), and physico-chemical elements of quality are assessed.
Ecological potential determines the status of a heavily modified or artificial surface water body. Good status of surface waters is defined as the status of a body of surface water where its ecological and chemical status is at least good. Assessment of the status of water bodies is an integral part of river basin management plans according to the WFD, which are processed in six-year cycles.
The results of the assessment are subsequently a fundamental basis for the proposal of a programme of measures to improve water status (or the determination and justification of exceptions to achieving good status) and other activities in the field of water management at the level of both the country and sub-basins. As part of the plans for the third planning period (2022–2027), the status of surface water bodies was evaluated according to monitoring data in 2016–2018 [4]. According to Section 4 of Decree No. 98/2011 Coll., on the method of assessing the status of surface water bodies, the method of assessing the ecological potential of heavily modified and artificial surface water bodies and the requirements of programmes for the detection and assessment of the status of surface water, as amended [3], the status of surface water bodies should be assessed every three years. The status of surface water bodies, which is the subject of this article, was evaluated for 2019–2021.
METHODOLOGY AND MATERIAL
Methodological procedures and official methodologies approved by the Department of Water Protection of the MoE for the third planning period (2015–2021) were used for the assessment itself. These procedures fully respect the requirements of the WFD and related documents (other EU directives and relevant directive documents); at the same time, these procedures respect the requirements of national legislation and other relevant documents. In connection with the overall assessment of the chemical status and ecological status/potential, and with the assessment of individual chemical and physico-chemical indicators, it was [5–11].
Chemical and ecological status/potential was assessed based on actual measured data in representative monitoring sites of surface water bodies. The evaluation of individual priority substances (chemical status) and specific pollutants (ecological status/potential) was carried out separately for the individual years 2019, 2020, and 2021 and aggregated into the final outputs for the entire three-year period. The final assessment was determined by the worst year of the assessed period. General physico-chemical indicators of ecological status/potential were evaluated for the entire three-year period. The resulting assessment of the chemical and ecological status/potential was related to the entire water body to which the representative monitoring site relates.
The evaluation of chemical and physico-chemical indicators was carried out using modified software tools developed by TGM WRI and updated in 2019. The delineation of water bodies, their categories and hydromorphological character (i.e., division into natural, heavily modified and artificial water bodies) corresponded to the third planning period. A total of 1,118 bodies of surface water were assessed, of which 1,045 were in the “river” category and 73 in the “lake” category. For water bodies in the “river” category, 942 were defined as “natural”, 98 as “highly modified”, and five as “artificial”. For the bodies in the “lake” category, 69 were defined as “heavily modified” and four as “artificial”.
The “one out – all out” principle was always observed in the system for assessment the status of surface waters, in accordance with the requirements of relevant legislative regulations at the level of the Czech Republic and the EU. It therefore applies that the worst of the results of the relevant partial elements or indicators is always decisive for the final assessment. The assessment results for 2019–2021 were subsequently compared with the results for 2016–2018. Both the assessment of the chemical and ecological status/potential of individual water bodies and the evaluation of individual chemical and physico-chemical indicators were compared. In order for the comparison to be relevant, it is necessary to fulfil the conditions regarding the evaluation procedures and input data. The evaluation procedures, including the criteria for classification of status, were the same for both assessed periods.
In 2019–2021, monitoring was carried out on an approximately 10 % larger scale. When applying the “one out – all out” principle, this can lead to slightly worse results in the ecological status/potential or the chemical status of individual water bodies. The evaluation of 2019–2021, on the other hand, does not include hydromorphology (when evaluating the status for 2016–2018, the “one out – all out” principle was not applied to the hydromorphological element).
The status of surface water bodies for 2019–2021 was evaluated based on data from the monitoring of the River Boards state enterprises. The data was provided mainly from the IS Arrow, managed by CHMI. Data from the monitoring of selected priority and priority hazardous substances in biota used for the assessment of the chemical status of surface water bodies was obtained from the monitoring of solid matrices, which is provided by CHMI. TGM WRI participated in the assessment of the status, evaluating chemical and physico-chemical indicators and the overall ecological and chemical status and compared the results of the assessment with the results for the previous threeyear period 2016–2018; the Biological Centre CAS, p. r. i., evaluated the biological elements of the ecological status of the water bodies in the “lake” category; CHMI evaluated the biological elements of the ecological status of the water bodies in the “river” category. The following results are focused on the assessment prepared by TGM WRI. The assessment was created (on the basis of a contractual relationship) in 2023 for the River Boards state enterprises.
In addition to the results of the actual assessment, an even more detailed comparison was processed of the most important physico-chemical and chemical indicators between the two three-year periods. This was done by comparing the percentage of unsatisfactory results to the classified ones, which is especially important for indicators that are not classified across the board, either because of the smaller scope of monitoring, or a high number of measurements, which could not be evaluated mainly due to the high limits of determination (compared to the very low values of environmental quality standards). Also, the proportion of monitored and classified water bodies against the total number of water bodies was compared.
RESULTS
Chemical status
The results of the assessment of chemical status of surface water bodies during the monitoring period 2019–2021 are illustrated by the map in Fig. 1 and the graph in Fig. 2. In 2019–2021, good chemical status was achieved for 285 bodies (270 bodies in the “river” category and 15 in the “lake” category); 644 bodies were classified in “not achieving good status” category (639 in the “river” category and five in the “lake” category); and for 189 bodies the chemical status was evaluated as unknown (136 in the “river” category and 53 in the “lake” category).
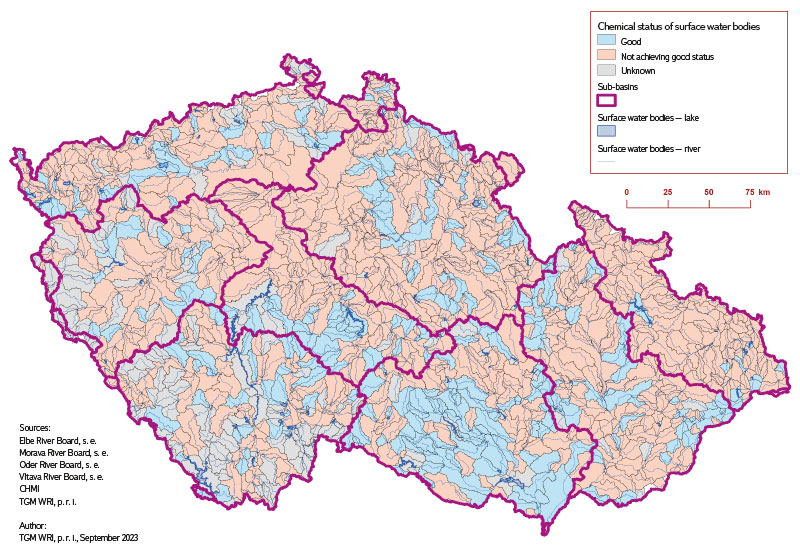
Fig. 1. Chemical status of surface water bodies 2019–2021
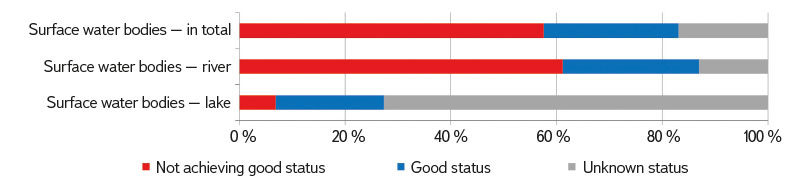
Fig. 2. Chemical status of surface water bodies 2019–2021 in categories „river“ and „lake“
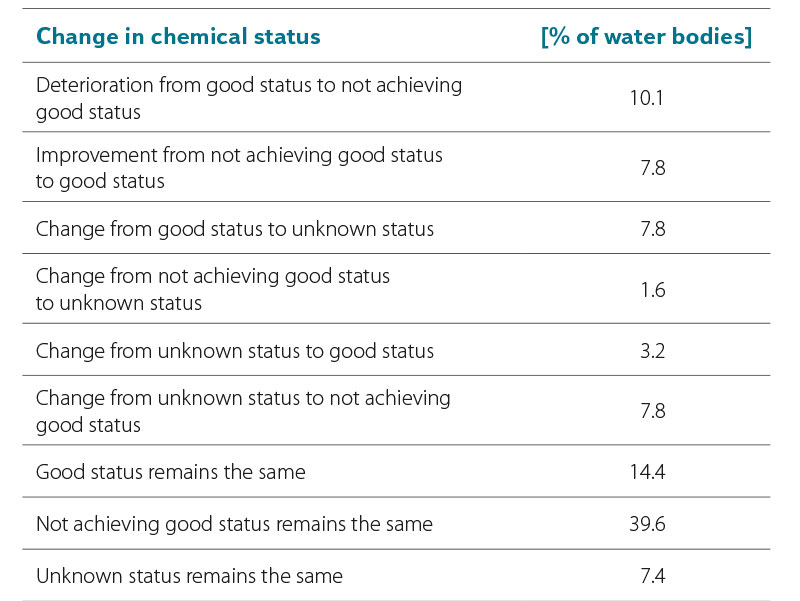
Tab. 1 and 2 shows a comparison of the evaluation of chemical status for 2019–2021 with the evaluation for 2016–2018. The comparison shows a slight increase in the total proportion of water bodies classified in “not achieving good status” category (by 8 % of formations) compared to 2016–2018, which is caused by polyaromatic hydrocarbons (mainly benzo[ghi]perylene and benzo[k]fluoranthene). In water bodies of the “lake” category, an increase in the proportion of water bodies of unknown chemical status is noticeable, caused by a reduction in the scope of priority substance monitoring. The graph in Fig. 3 shows the evaluation of priority substances for which the environmental quality standards (EQS) were not met in at least 10 % of water bodies in 2019–2021. It is apparent that polyaromatic hydrocarbons are particularly problematic. For substances evaluated in the “biota” matrix, EQS are not fulfilled, especially for mercury and brominated diphenyl ether. For both substances, the EQS is not met in the long term in any of the monitoring profiles. The monitoring range of substances in the “biota” matrix is very low (maximum 3 % of water bodies).
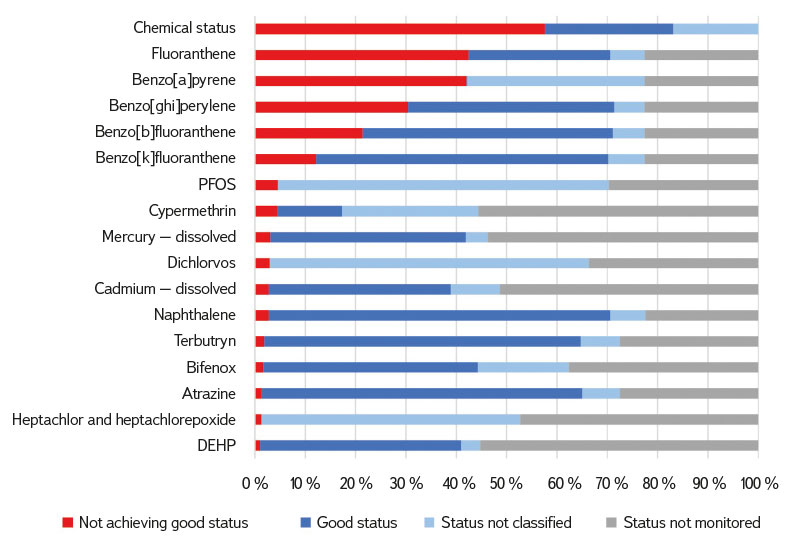
Fig. 3. Chemical status of surface water bodies 2019–2021 by selected priority substance assessment
Tab. 1. Chemical status of surface water bodies 2019–2021 and a 2016–2018
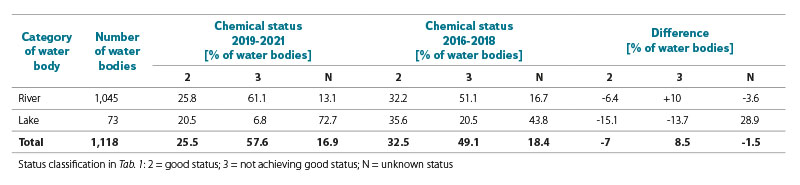
Tab. 2. Changes in the assessment of the chemical status of surface water bodies between 2016–2018 and 2019–2021
Ecological status/potential
The map in Fig. 4 and the graph in Fig. 5 show the results of the evaluation of ecological status/potential of surface water bodies in 2019–2021. In 2019–2021, good ecological status or good and better potential was achieved in 83 bodies (77 in the “river” category and 6 in the “lake” category), medium status/potential was classified for 633 bodies (600 in the “river” category and 33 in the “lake” category), damaged status/potential was classified for 246 bodies (234 in the “river” category and 12 in the “lake” category), destroyed status/potential was classified for 153 bodies (134 in the “river” category and 19 in the “lake” category), and unknown status/potential was classified for 3 bodies (all in the “lake” category).
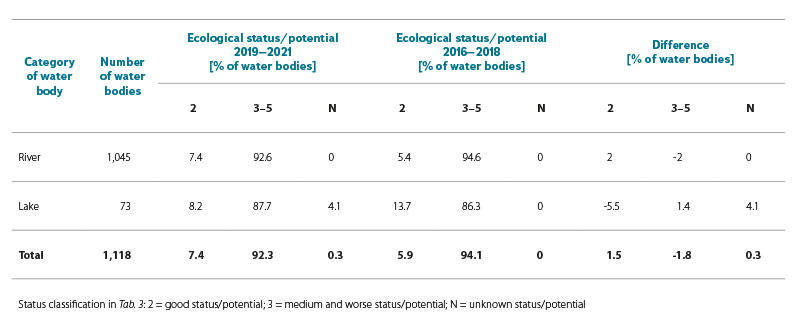
Very good status was not achieved for any water body. Tabs. 3 and 4 show a comparison of the evaluation of the ecological status/potential for 2019–2021 with the evaluation for 2016–2018. The comparison shows only very slight changes between the three-year evaluations. For bodies in the “lake” category, a slight increase in the proportion of bodies in an unknown status/potential is noticeable, caused by a reduction in the scope of monitoring.
The assessment of biological elements (in total) and general physico-chemical indicators is shown in the graph in Fig. 6 for bodies in the “river” category and in Fig. 7 for bodies in the “lake” category. The evaluation of specific pollutants is shown in the graph in Fig. 8 (only substances that do not comply in at least two water bodies are listed). The graphs show that the resulting ecological status or potential is most affected by the evaluation of general physico-chemical elements (almost 86 % of bodies do not reach good status/potential) and biological elements (72 % of bodies are in worse than good status/potential) – see Figs. 6 and 7. The proportion of unsatisfactory water bodies due to specific pollutants is smaller (44 %) – see Fig. 8.
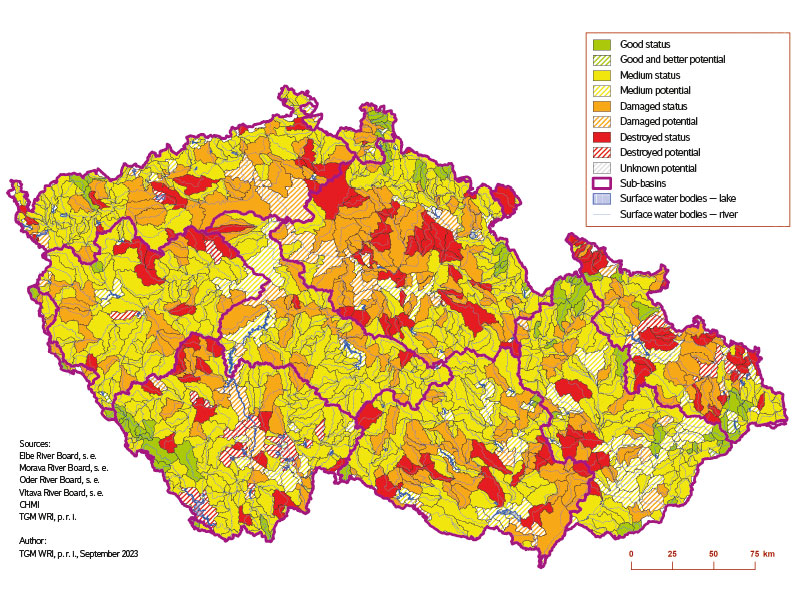
Fig. 4. Ecological status/potential of surface water bodies 2019–2021
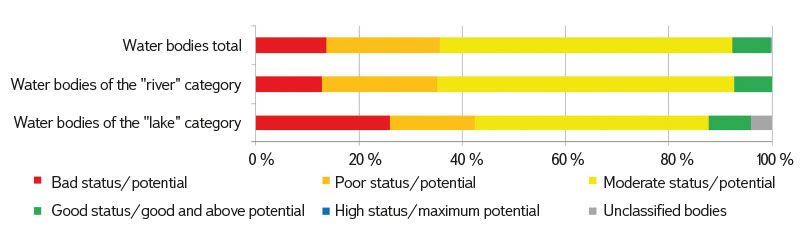
Fig. 5. Ecological status/potential of surface water bodies 2019–2021 in categories „river“ and „lake“
Tab. 3. Ecological status/potential of surface water bodies 2019–2021 and 2016–2018
Tab. 4. Changes in the assessment of the ecological status/potential of surface water bodies between 2016–2018 and 2019–2021
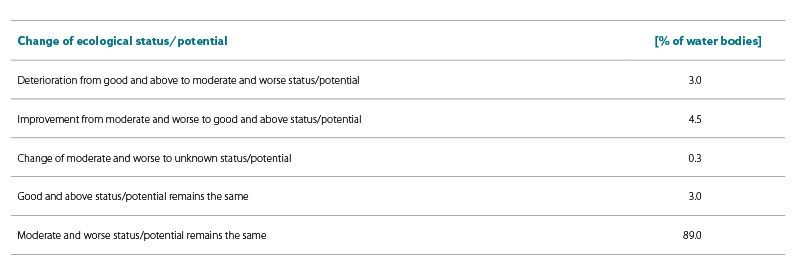
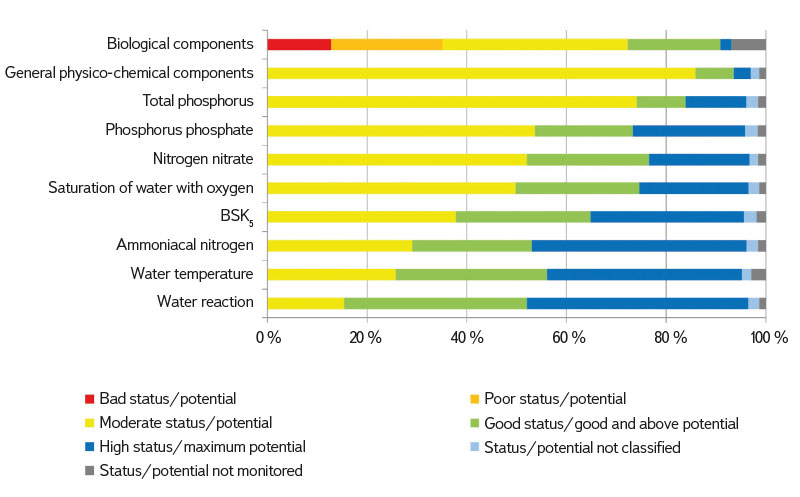
Fig. 6. Ecological potential of surface water bodies of the category „river“ according to the assessment of biological and physico-chemical components for the period 2019–2021
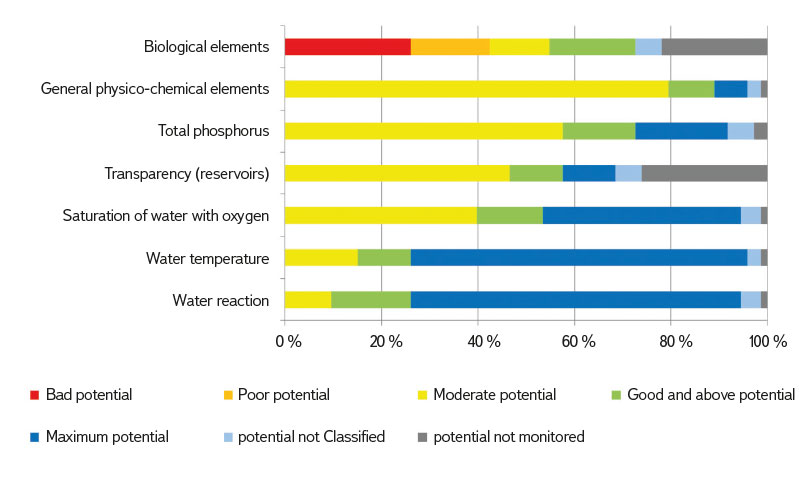
Fig. 7. Ecological potential of surface water bodies of the category „lake“ 2019–2021 according to the assessment of biological and physico-chemical components for 2019–2021
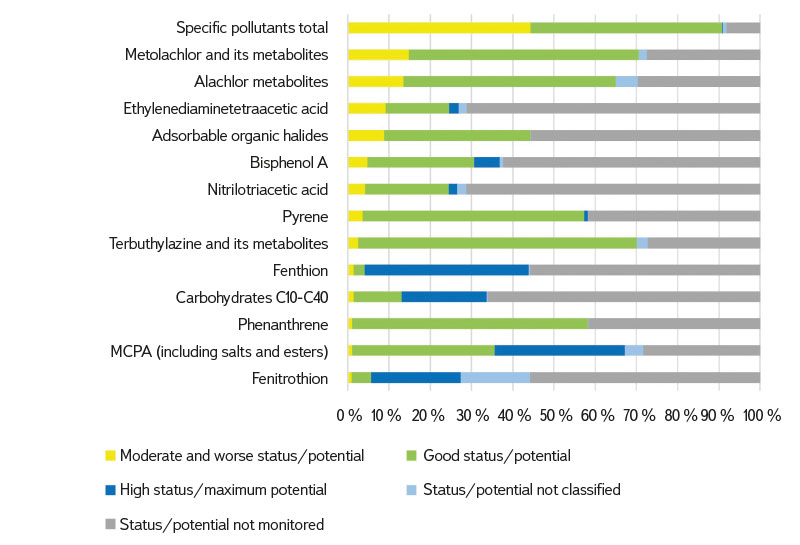
Fig. 8. Ecological status/potential of surface water bodies according to the assessment of selected specific pollutants for 2019–2021
Evaluation of chemical and physico-chemical indicators
and their comparison with 2016–2018
If we want to find out where the Czech Republic fails to achieve good status, it is necessary to focus on individual indicators or elements; the same applies to an even greater extent for comparing the results of chemical and ecological status. At the same time, there are a lot of indicators of chemical status and specific pollutants of the ecological status assessed (54 priority substances and 83 specific pollutants); in addition, for a significant part of the indicators, no unsatisfactory water body was found (for 23 priority substances and 42 specific pollutants), therefore a more detailed evaluation focuses on those indicators that do not exist for at least 10 water bodies in the Czech Republic and, at the same time, are probably not of a natural origin (applies to iron and manganese).
Fifteen priority substances (Fig. 3) and thirteen specific pollutants (Fig. 8) correspond to these conditions.
The periods 2019–2021 and 2016–2018 are suitable for comparison because the same methodologies and relevant limits (e.g. EQS) were used for the status/potential classification. Similarly, there was no change in the delineation of water bodies or their inclusion in natural, heavily modified and artificial bodies. However, at the level of the overall chemical and ecological status/potential, the results (and comparability of the period) are affected by the range of monitored indicators in a representative profile (“one out – all out” principle).
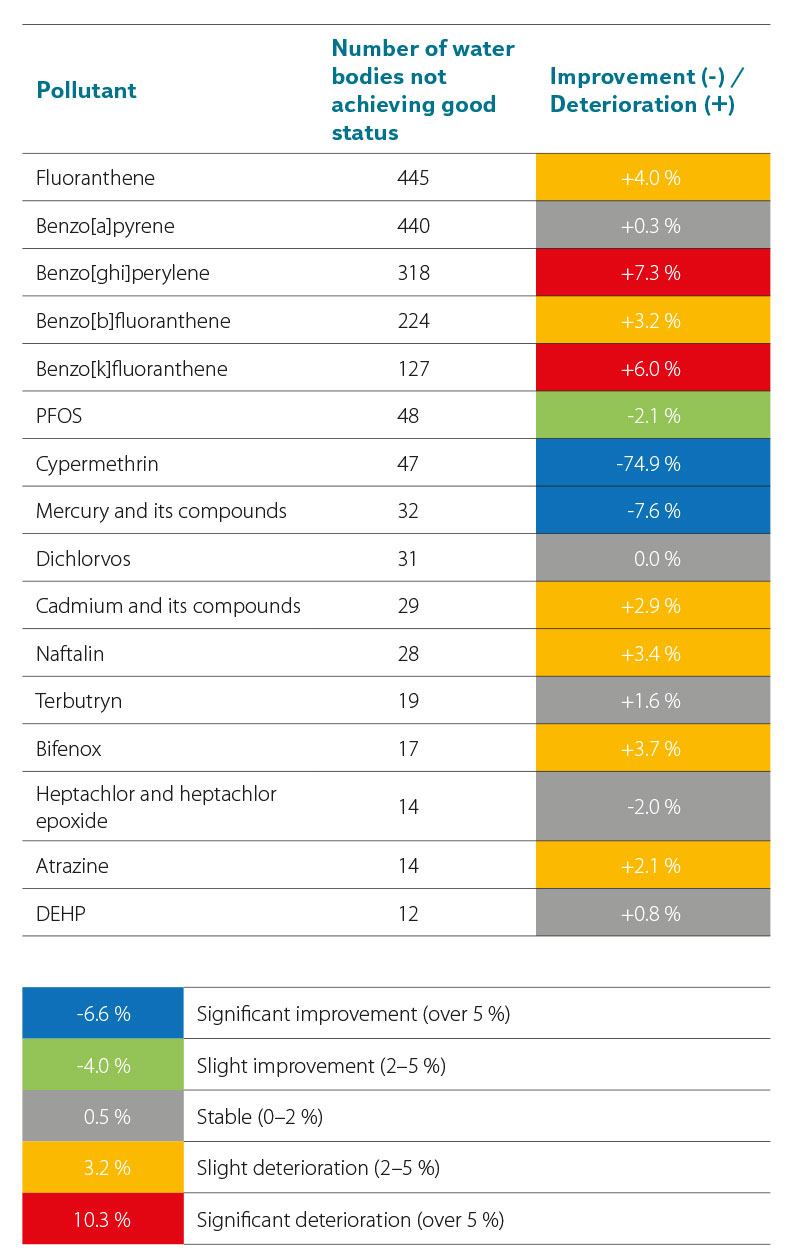
The evaluation results for individual elements and indicators are similar to the evaluation of the previous three-year period. For the chemical status, polyaromatic hydrocarbons (fluoranthene, benzo[a]pyrene, benzo[ghi]perylene, benzo[b]fluoranthene, benzo[k]fluoranthene, naphthalene), perfluorooctanesulfonic acid and its derivatives (PFOS) showed poor results most often, less often metals – mercury and cadmium – and some pesticides – cypermethrin, dichlorvos, bifenox and terbutryn (Fig. 3). The biggest differences between the current (2019–2021) and the previous (2016–2018) three-year period can be found for cypermethrin – see Tab. 5 (improvement by 75 % of the proportion of classified bodies). This is due to the fact that the number of monitored
bodies increased significantly, mainly in the sub-basin of the Upper and Middle Labe, whereby 133 new satisfactory water bodies were found, compared to none in the past three years, while 47 (originally 15) bodies were unsatisfactory. In contrast, the biggest deterioration was for benzo[ghi]perylene (by 7 % of the proportion of classified bodies) and benzo[k]fluoranthene (by 6 % of the proportion of classified bodies); in the case of benzo[ghi]perylene, this is mainly due to the fact that a significant amount of water bodies that were satisfactory in the last three years were not monitored in the current threeyear period. In the case of benzo[k]fluoranthene, a partial deterioration was manifested in particular in the Upper Odra sub-basin; there were no significant
changes in the other sub-basins.
For easier orientation, changes in the assessment of indicators are shown in colour in Tabs. 5, 6, 7, and 8: blue indicates significant improvement (over 5 %), green moderate improvement (2–5 %), grey stable status (0–2 %), yellow moderate deterioration (2–5 %), and red significant deterioration (over 5 %).
Tab. 5. Changes in the assessment of the selected chemical status of surface water bodies between 2016–2018 and 2019–2021
Tab. 6. Changes in the assessment of surface water bodies category „river“ of physico-chemical elements between 2016–2018 and 2019–2021
Tab. 7. Changes in the assessment of surface water bodies category „lake“ of physico-chemical elements between 2016–2018 and 2019–2021
Tab. 8. Changes in the assessment of the selected specific polutants between 2016–2018 and 2019–2021
In order to better understand the differences between the assessment in 2019–2021 and 2016–2018, it is necessary to look at the changes between the number of classified and monitored bodies for selected indicators (Fig. 9). If we were interested in all 54 priority substances, the difference between the three-year periods is minimal – in the current three-year period, the number of classified bodies slightly decreased (by 0.2 percentage points); monitored bodies, on the other hand, increased by 3 percentage points. The summary for the individual indicators is much more interesting – the highest decrease of the monitored bodies is visible for mercury and cadmium, which was due to the fact that, in the last threeyear period, those bodies were included in the assessment for which undissolved forms of metals were also monitored (and for the sake of the assessment, recalculated to dissolved form), whereas in the current three-year period, the water bodies with monitoring of only undissolved metals were included in non-monitored ones. The highest decrease in classified bodies was again for mercury and cadmium (for the same reason).
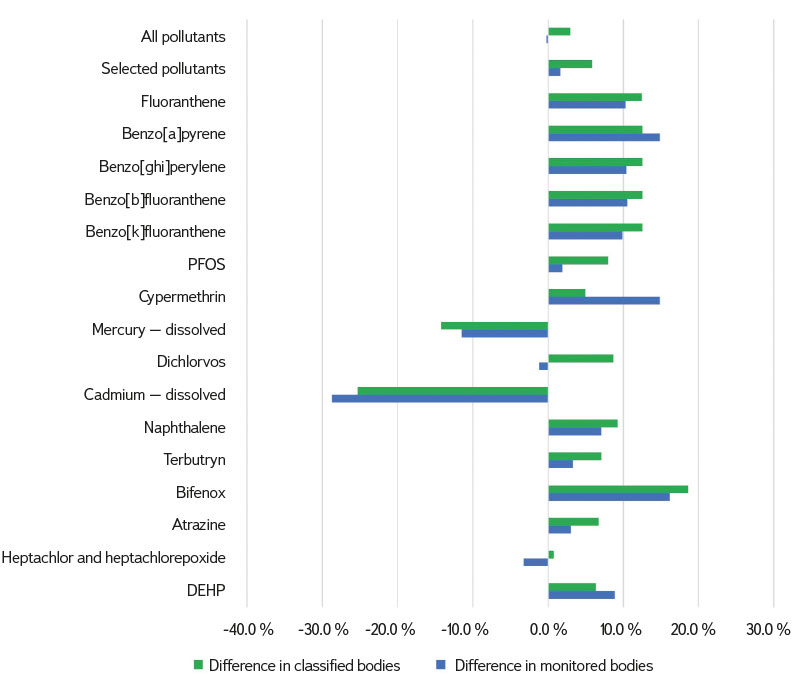
Fig. 9. Changes in the proportion of the selected priority substances classified and monitored between 2016–2018 and 2019–2021
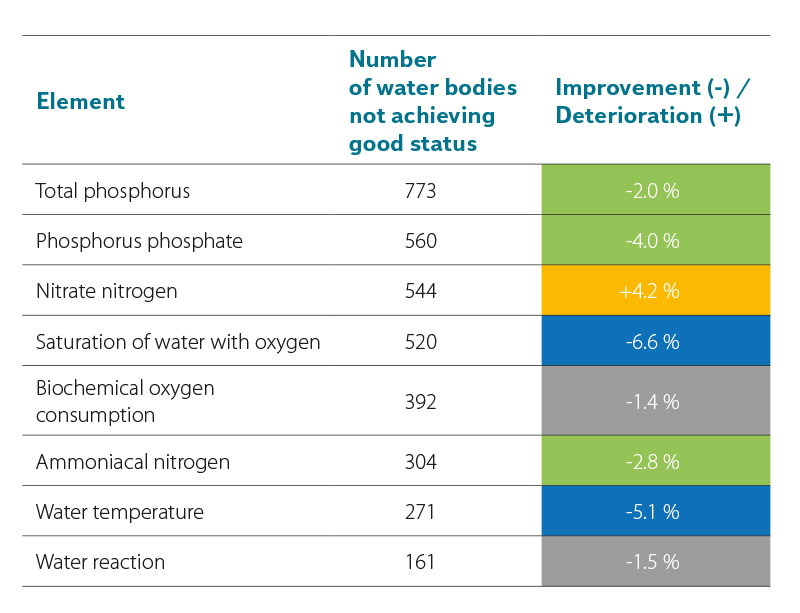
The most common reason for poor ecological status/potential are general physico-chemical indicators: total phosphorus, phosphorus phosphate, nitrate nitrogen (applies only to the “river” category), water saturation with oxygen, five-day biochemical oxygen consumption, ammonia nitrogen (applies only to the “river” category), water temperature, and water reaction (Figs. 6 and 7).
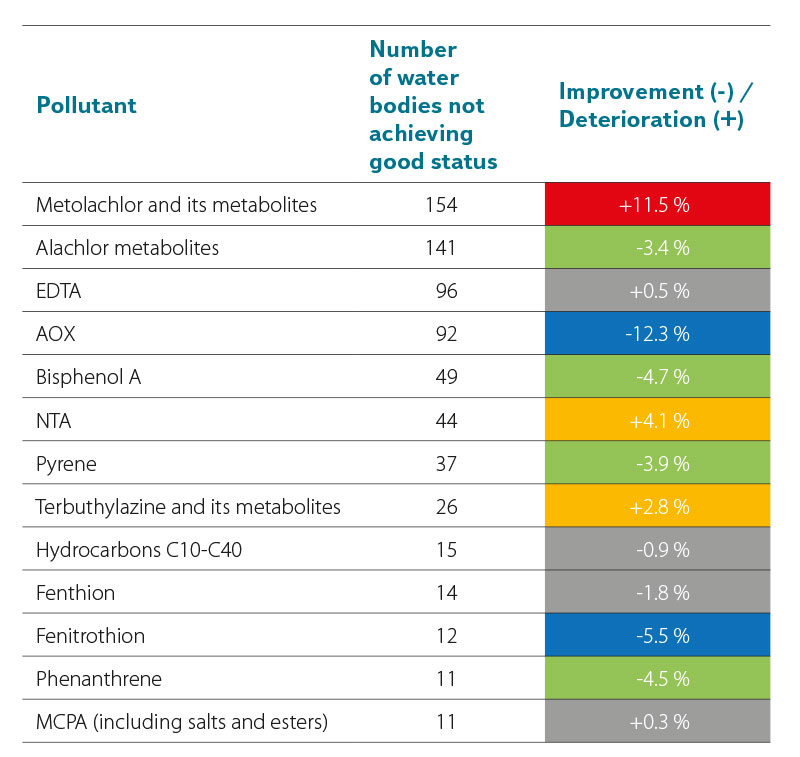
A smaller proportion of unsatisfactory water bodies can be seen in the case of some specific pollutants – most often pesticide metabolites (metolachlor and its metabolites, alachlor and its metabolites, less terbuthylazine and its metabolites) and ethylenediaminetetraacetic acid (EDTA) – see Fig. 8. In the case of rivers, the biggest differences between the current (2019–2021)
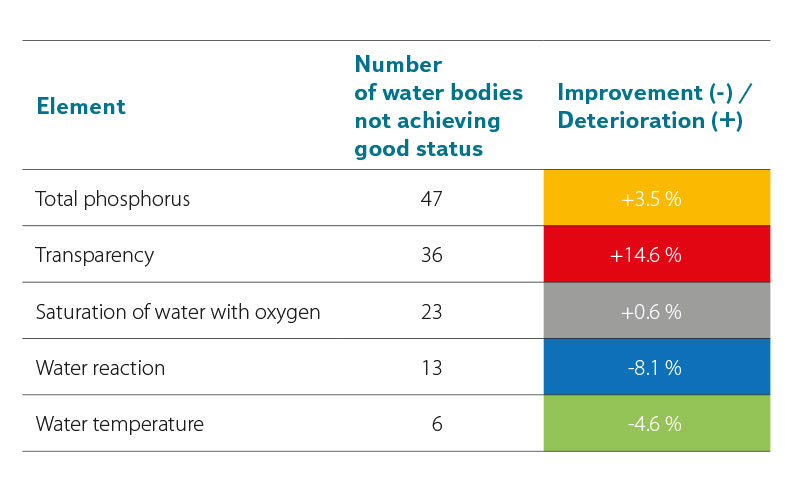
and the previous (2016–2018) three-year period can be found in water oxygen saturation (improvement by 7 percentage points from the proportion of classified bodies) and water temperature (by 5 percentage points from the proportion of classified bodies) – see Tab. 6. In the case of lakes, the situation was significantly different; only water reaction showed a significant improvement
(by 8 percentage points). On the other hand, the biggest deterioration was in transparency (by 15 percentage points from the proportion of classified bodies) – see Tab. 7.
The biggest differences for specific pollutants were for adsorbable organic halides (AOX) – an improvement of 12.3 percentage points. In contrast, the biggest deterioration was for metolachlor and its metabolites – by 11.5 percentage points. In the case of AOX, there was a reduction in the proportion of monitored and classified bodies (Fig. 10); however, this concerned almost exclusively
those units that were in good status in the last three-year period. In the case of metolachlor and its metabolites, the increase in the proportion of unsatisfactory bodies was probably a combination of two factors: the actual deterioration in 64 water bodies, and the expansion of monitoring revealing quite a high number of unsatisfactory bodies (albeit significantly less than those newly found in good status).
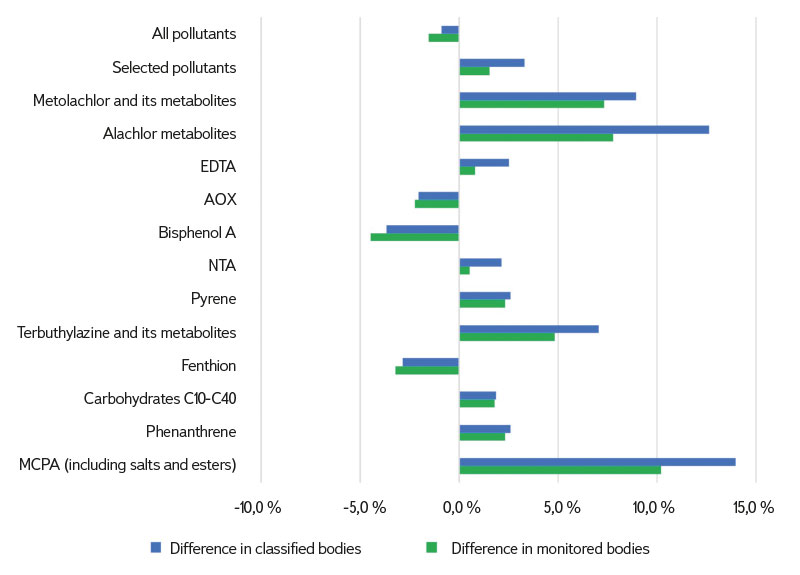
Fig. 10. Changes in the proportion of the specific pollutants classified and monitored between 2016–2018 and 2019–2021
As for the changes between the number of classified and monitored bodies for selected specific pollutants (Fig. 10), the changes for all indicators are again minimal. The highest decreases of both monitored and classified bodies are evident for bisphenol A (by 3.7 and 4.5 percentage points, respectively) and slightly less for fenthion and AOX. In all these cases, mainly the monitoring of water bodies in good status in the last three-year period was limited. In all other cases, there was an increase in both monitored and classified bodies.
CONCLUSION
The status of surface water bodies was evaluated based on actual measured data for 2019–2021. 1,118 water bodies were assessed (1,045 in the “river” category and 73 in the “lake” category), as defined for the third planning period. Also, the methodological procedures corresponded to the procedures for the previous evaluation period 2016–2018, which was incorporated into the third river basin management plans. The same delineation of water bodies and evaluation procedures made it possible to assess the development of the status in the last two evaluated three-year periods, at least at the level of individual chemical and physico-chemical indicators. (At the level of the overall chemical and ecological status/potential, the comparison limits the increased scope of monitoring in the period 2019–2021 when applying the “one out – all out” approach.) Good chemical status was not achieved in 61 % of water bodies. The occurrence of polycyclic aromatic hydrocarbons (especially fluoranthene and benzo(a)pyrene, where EQS were exceeded in more than 40 % of water bodies) had an effect on the failure to achieve good chemical status. In the “biota” matrix, long-term problematic substances are mercury and brominated diphenyl ether. When compared to the previous assessment in 2016-2018, there was a deterioration in benzo[ghi]perylene and benzo[k]fluoranthene. In contrast, there was an improvement in the assessment of mercury in the “water” matrix. Good ecological status or potential was not achieved in 92.6 % of water bodies. The failure to achieve good ecological status/potential was mainly influenced by the status of biological elements and the occurrence of total phosphorus (for the “river” category, the criteria for achieving good status are not met in more than 70 % of water bodies). When compared to the previous assessment in 2016–2018, there were no significant differences in general physico-chemical indicators for the “river” category; for the “lake” category, the assessment for transparency worsened, and the assessment for the water reaction indicator improved. For specific pollutants, the assessment of metolachlor and its metabolites worsened, and the assessment of AOX and fenitrothion improved. Simultaneously, an increase in the proportion of both monitored and classified water bodies was confirmed for almost all significant indicators of priority and specific pollutants compared to the previous three-year period, and, with the exception of cadmium and mercury (where conversions of total metals to dissolved form were not used for the first time), the other reductions were overwhelmingly due to better knowledge of pollution by individual pollutants in individual bodies, where it was possible to omit mainly bodies that were in good status in the previous three-year period from monitoring in the current three-year period.
Acknowledgements
The authors thank the Vltava River Board, Elbe River Board, Ohře River Board, Morava River Board and Oder River Board state enterprises for the data provided and their consent to the publication of the above-mentioned summary results of the assessment of the status of surface waters for 2019–2021. They also thank the Ministry of the Environment; with its financial support, the authors prepared a comparison of the results of the status assessment for 2019–2021 with the results for 2016–2018.
The Czech version of this article was peer-reviewed, the English version was translated from the Czech original by Environmental Translation Ltd.
