ABSTRACT
This article describes the HYMOD-KZ database, available at https://shiny.vuv.cz/HYMOD-KZ/. The database provides detailed results of hydrological modelling and hydrological balance analysis of catchments (water bodies) for current and future climate conditions; it also includes updated deficit areas, the description of which is part of this article. This tool can serve as a foundation for water management experts, academia, and the broader professional community as it provides outputs at the spatial resolution of water bodies. The graphical representation of results facilitates understanding of complex hydrological phenomena and supports decision-making in water management planning.
INTRODUCTION
Climate change represents one of the most significant environmental challenges, fundamentally affecting the availability and quality of water resources [1, 2]. In the Czech Republic, climate change manifests itself mainly through an increase in air temperatures, changes in precipitation distribution, increased frequency and intensity of drought and, conversely, short-term extreme precipitation events that can lead to floods [3, 4]. These changes disrupt the hydrological balance of the landscape, affect water balance, and contribute to the reduced availability of groundwater and surface water supplies, which are key for supplying the population, agriculture [5], and industry.
In some areas of the Czech Republic, which are already classified as deficient in terms of water regime, climate change impacts are deepening. The lack of water manifests itself both in the dry season, when river levels drop and the availability of water for various purposes decreases, and in the winter months, when reduced water reserves via snow cover contribute to low flows in the spring season. These issues are exacerbated by rising air temperatures, which increase evaporation and thus further reduce water availability in the landscape.
The HYMOD-KZ database is a tool that shows the results of hydrological modelling and water balance analysis for current and future climate conditions in the Czech Republic. This tool uses advanced hydrological modelling methods that include both spatial interpolation of meteorological data and simulations of water regime changes based on different climate scenarios. The database provides spatially explicit information on water balance, which enables a detailed assessment of the impacts of climate change on individual basins and water bodies.
Within the HYMOD-KZ database, so-called deficit areas are also identified, where the climatological water balance is significantly negative, which indicates risks for sustainable management of water resources. This information is key for planning water management measures, such as building new retention reservoirs, optimizing the use of water resources, or implementing adaptation strategies aimed at improving the landscape’s storage capacity. The database is therefore a tool (base) for experts in water management, who can use the data to support decision-making and create long-term strategies to mitigate the impacts of climate change.
METHODOLOGY AND DATA
Current climate conditions
Climate data for 1961–2020 was used for the actual assessment of current conditions, namely a time series of air temperatures and precipitation totals. Since long time series contain measurement errors, inhomogeneities caused by moving the station, changing instruments or observers, or measurement failures, it is necessary to clean the data series from these influences. For this purpose, the data underwent a quality control within the CLIDATA database at CHMI. All data were tested for inhomogeneities in the series and these were corrected using the proprietary DAP method. Any missing data from 1961–2020 were added based on interpolation methods. Station data processed in this way were subsequently interpolated into a grid network with a spatial resolution of 500 m. For each day, the dependence on terrain parameters (altitude, slope, roughness) was determined as well as on latitude and longitude. The basis for spatial interpolation is a terrain map with a resolution of 500 × 500 m. The result of spatial interpolation are layers (GeoTIFF) of meteorological variables in a daily time step, which were used to derive time series for the studied area (to the centre of individual surface water bodies). The period 1991–2020, which corresponds to the current reference period, was used for the assessment itself.
Climate change scenarios in water management
Climate models are mathematical representations of the physical processes that take place in the atmosphere, oceans, ice sheets, and land. They are used to simulate past, present, and future climate on Earth. Global climate models (GCMs) work with a coarse spatial resolution, which means that smaller geographical areas, such as the Czech Republic, are not accurately represented in these models. Therefore, regional climate models (RCMs) are used at the regional level, spatially refining the GCM outputs. Both GCM and RCM have their advantages and disadvantages [6].
The most recent CMIP6 GCM [7, 8] simulations include models with different spatial resolutions, mostly around 100 or 250 km. However, some models with a resolution of 50 km end the simulations in the mid-21st century. The models differ in complexity of the climate system description and parameterization of smaller scales, which leads to differences between simulated climate and reality. For Central Europe, GCMs that best simulate its climate were selected, ensuring that this selection was representative of the entire original set of models. Six models with a resolution of up to 100 km were selected that cover all emission scenarios and take into account basic meteorological elements.
Climate change scenarios (Shared Socioeconomic Pathways: SSP [9]) reflect different possible future global trajectories in terms of emissions and socio-economic development:
- SSP1–2.6: sustainable development
- SSP2–4.5: middle path with deterioration of environmental systems
- SSP3–7.0: regional rivalry and limited economic development
- SSP5–8.5: development based on fossil fuels
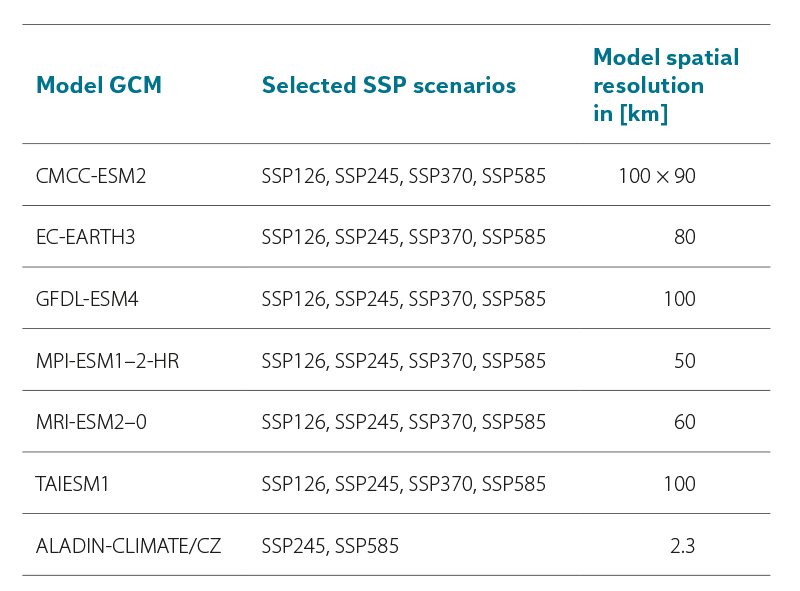
The selection of GCM models was carried out according to the methodology [10] and ensures reliable climate simulations of Central Europe. Furthermore, the ALADIN-CLIMATE/CZ regional model, which is characterized by high spatial resolution, was included. The ALADIN-CLIMATE/CZ model calculation area includes almost all of Europe with the Czech Republic in its centre, which is important for the actual modelling of the future climate; however, it is no longer needed for further processing of the results, so it was reduced [11]. The resulting set of used simulations is shown in Tab. 1.
Tab. 1. Selected GCM models from CMIP6 and ALADIN-CLIMATE/CZ simulations, their spatial resolution, and available SSP scenarios
For the creation of SSP scenarios in the context of estimating changes in the hydrological balance, the so-called incremental method is used as standard in the Czech Republic, especially for studies in monthly step. This method consists in transforming the observed data so that changes in transformed quantities correspond to changes derived from climate model simulations. In the monthly step, changes in average monthly precipitation totals and average monthly temperature are normally considered. In the daily step, it is also necessary to consider changes in the variability of quantities. Therefore, the Advanced Delta Change (ADC) incremental method was used to create SSP scenarios. The incremental method is based on transforming the observed data in a way that guarantees that the changes between the transformed and the original series are the same as the changes derived from the regional climate model. For precipitation and temperature (especially in the daily step) it is desirable that the considered transformations take into account changes in both average and variability. This simply means that the extremes can change in a different way than the average. When deriving precipitation changes from the climate model, the ADC method also considers systematic simulation errors. Since the temperature is transformed linearly, systematic error has no effect on the resulting temperature transformation [12]. For individual water bodies, selected [13] Global Circulation Models (GCM) and ALADIN-CLIMATE/CZ Regional Circulation Model were transformed by the selected method.
Hydrological balance modelling
To calculate hydrological balance, the BILAN conceptual model was used, which has been developed for more than 20 years in TGM WRI Department of Hydrology. The model calculates the chronological hydrological balance of the basin or area in daily and monthly time steps. It expresses the basic balance relationships on the surface of the catchment area, in the aerated zone (which also includes the basin vegetation cover), and in the groundwater zone. Air temperature is used as an indicator of energy balance, which significantly affects hydrological balance. Using the calculation, the potential evapotranspiration, land evaporation, infiltration into the aerated zone, seepage through this zone, water supply in snow, water supply in soil, and groundwater supply is modelled. Runoff is modelled as the sum of three components: two components of direct runoff (including subsurface runoff) and base runoff [15–18]. The daily version of the model, which is controlled by six parameters, was used to model the hydrological balance. The model uses linear and non-linear reservoirs to transform precipitation into runoff. The main inputs of the model are precipitation and air temperature (also measured runoff for calibration), the output is the modelled runoff from the basin and other hydrological balance components.
The calibrated BILAN hydrological model within the HAMR system [19] was used for the actual simulations.
Hydrological modelling of climate change
The procedure for modelling the climate change impact on the hydrological regime can be briefly summarized as follows:
- The selected hydrological model is calibrated for the selected catchment area using observed data. A hydrological model should be based on physics to guarantee that it will provide acceptable results even for unobserved conditions.
- The input variables from the global or regional climate model are converted to time series of scenarios for individual basins, in this case by subsequent processing of the climate model output, i.e. using the incremental method or correction of systematic errors. It is often necessary to use spatial interpolation to relate the data from the calculation cells of the climate model to the centre of the given basin. For the correct use of the methods, it is necessary to have the observed data available.
- Using a calibrated hydrological model and time series of scenarios, hydrological balance for the corresponding period is simulated.
The procedures are described in more detail in [15–19].
Deficit areas
Within the database, deficit areas of landscape water regime are displayed from a climatological point of view, without the water management aspect. Based on the analyses of the input variables, a simple interpretation of deficit areas was chosen based on the so-called climatological water balance, which is expressed by the following equation

where:
B is climatological water balance
P precipitation total
PET potential evapotranspiration
The balance was calculated for current and future conditions based on the aforementioned simulations, aggregated and divided into categories:
- Problem-free area: B > 0 mm
- Risk area: 0 mm > B > -100 mm
- Threatened area: -100 mm > B > -200 mm
- Critical area: B < -200 mm.
HYMOD-KZ database: Specialized public database
Based on the outputs (dealing with modelling climate change impacts on water regime) of TA CR projects (“Water Centre” and “PERUN”), the HYMOD-KZ database was created; it is available at https://shiny.vuv.cz/HYMOD- KZ/. The database runs on the equipment of TGM WRI in Prague. The aim of the database is to provide users with comprehensive information on water availability (natural water regime) for current and future conditions with an emphasis on individual climate model simulations.
Technical specification
The HYMOD-KZ database was created in the R programming language (version 4.3.1). The application’s interactive web interface is provided through an open-source superstructure in the form of Shiny packages (version 1.7.5.1) and flexdashboard (version 0.6.2), where Shiny provides the functionality of the user interface (i.e. contains all functions and calculations as well as instructions necessary for layout and appearance), while flexdashboard allows linking all Shiny components in the form of a single RMarkdown document. Furthermore, the application uses tools in the form of packages, such as tidyr (version 1.3.0) and dplyr (version 1.1.2), used for editing and transforming data, sf (version 1.0–13)
enabling work with the OpenGIS geographic data standard, Simple Features, and Leaflet (version 2.2.0), enabling the display of spatial data in the form of interactive maps.
Home page
The main menu for the database is via the opening page (Fig. 1), which shows:
- Logo and project name, and database logo.
- Public Database Section: Contains links to sections such as “Hydrological Balance” and “Deficit areas” that provide users with access to relevant information and data.
- Contact information: On the right, the contact information for the researchers, including their institutions and locations, is listed.
- Project summary.
Fig. 1. Main menu of the HYMOD-KZ database home page
Hydrological balance
The “Hydrological balance” component displays a summary of basic hydro-climatological parameters for individual water bodies. Fig. 2 shows the user interface with different selection options. The user can select different variables:
- BF – basic runoff [mm],
- ET – current evapotranspiration [mm],
- INF – infiltration [mm],
- P – precipitation total [mm],
- PET – potential evapotranspiration [mm],
- RM – modelled runoff [mm],
- SS – water supply in snow [mm],
- SW – water supply in soil [mm],
- T – air temperature [oC].
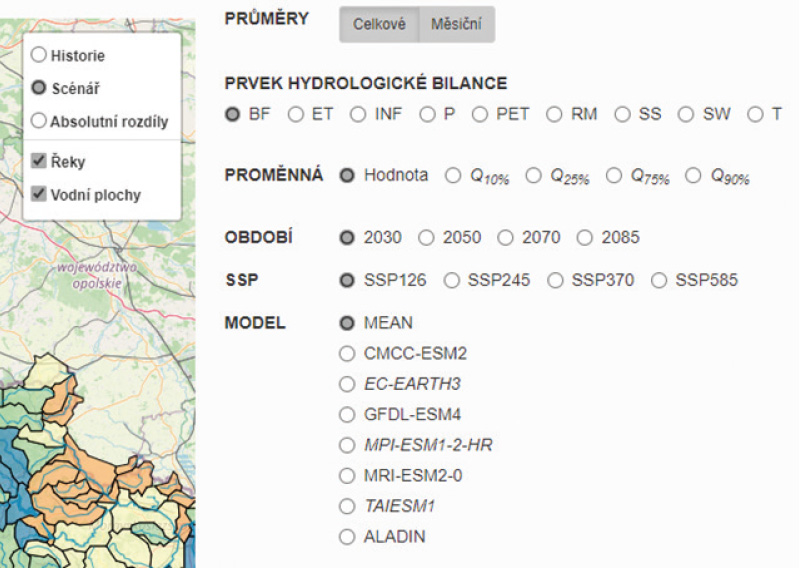
Fig. 2. HYMOD-KZ database main menu: options for selecting variables and time period in the “Hydrological balance” component
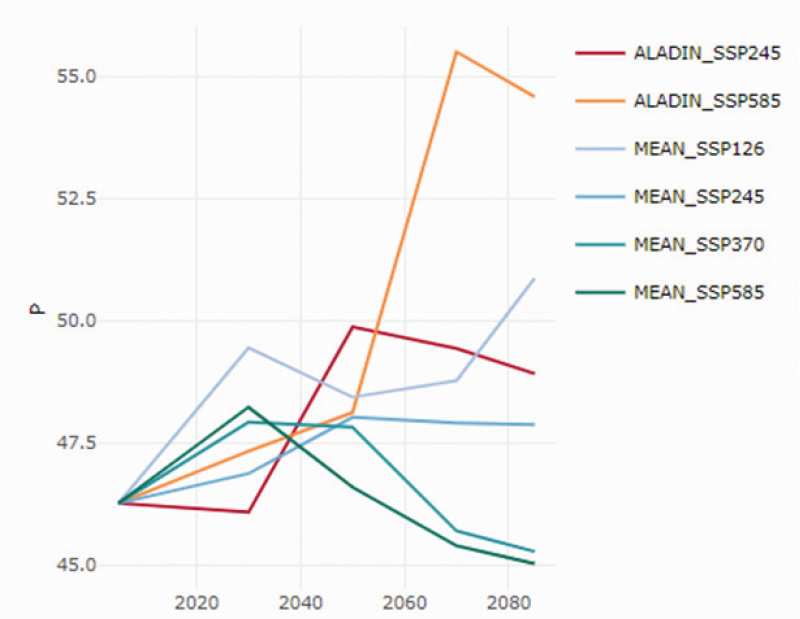
Fig. 3. Development of the selected variable in a specific water body based on individual SSP scenarios and the ALADIN-CLIMATE/CZ model
The values are aggregated into monthly (“Monthly” tab) and annual values (“Total” tab) and further derived basic static quantities such as the average (“Value”) or partial quantiles (10%, 25%, 75%, and 95% ). Within the application, it is also possible to choose between different periods (2030, 2050, 2070, 2085) and different socioeconomic pathways (SSP126, SSP245, SSP370, SSP585), indicating possible future development scenarios.
Ater this choice, climate models such as MEAN (average of all models), CMCC-ESM2, EC-EARTH3, GFDL-ESM4, MPI-ESM1-2-HR, MRI-ESM2-0, TAIESM1, and ALADIN (ALADIN- CLIMATE/CZ) are listed, which represent different climate models used for simulations. It is also possible to display values for the present 1991–2020, “History”, scenario values (“Scenario”) for the 2030, 2050, 2070, and 2085, and absolute differences between the future and the present for the selected quantity.
The graph (Fig. 3) shows development of the selected variable, quantile, and water body according to individual SSP scenarios and simulations by the ALADIN-CLIMATE/CZ model for individual time horizons.
Fig. 4 shows overall output composition, which consists of a map window and graphs based on the selected combination (in this case, absolute values of precipitation total for the variant: outlook to 2050, SSP126, and MEAN – arithmetic mean of all simulations).
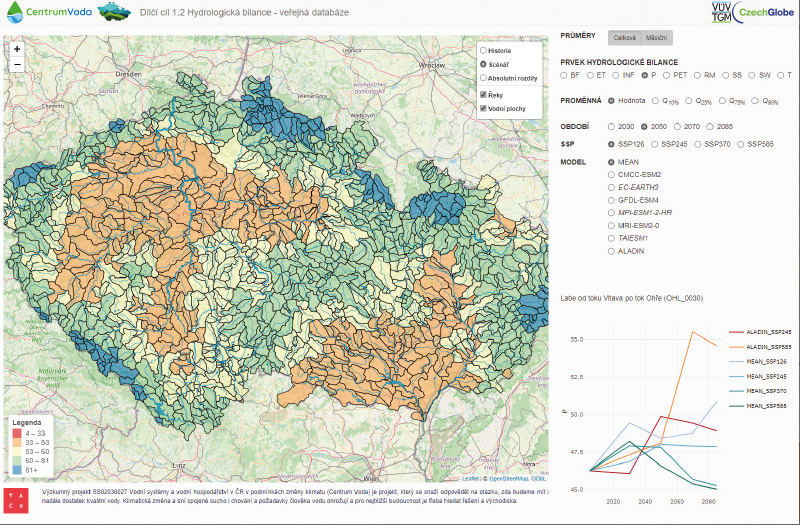
Fig. 4. Precipitation total for scenarios: outlook to 2050, SSP126, and MEAN (arithmetic mean of all simulations)
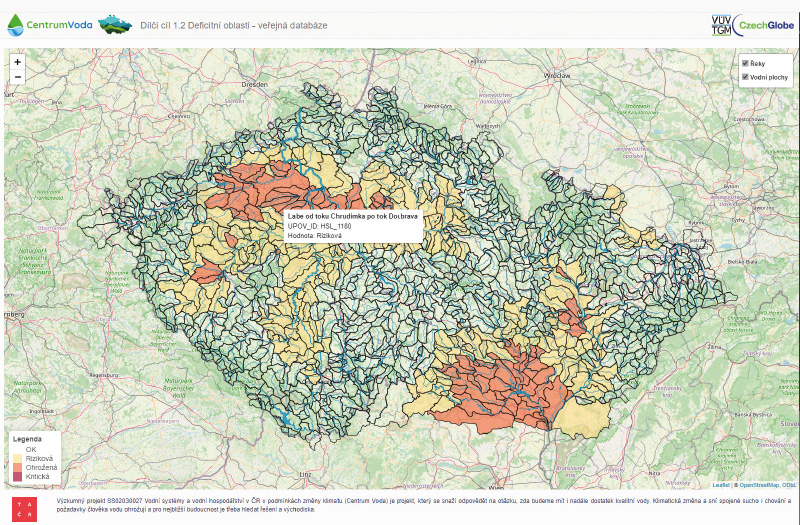
Fig. 5. Evaluated deficit areas
Deficit areas
At the beginning of the “Water Centre” project (2020), so-called deficit areas of the Czech Republic were defined, which were determined by expert assessment based on previous studies dealing with the impact of climate change on water regime and the definition of problematic hydrogeological regions. As part of the “Water Centre” project, these areas were specified based on the use of hydrological balance modelling in the distinction of water bodies and the updating of outputs from climate models. Adaptation measures should be proposed for deficit areas and their impact on the water regime of the given location should be evaluated.
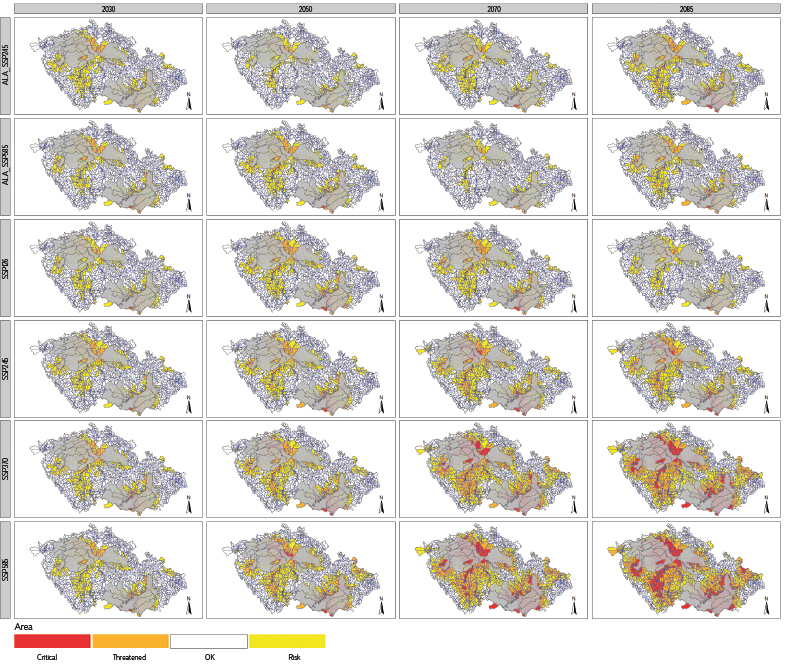
Based on the aforementioned methodology for calculating deficit areas, the “Deficit areas” component shows a map of the Czech Republic (Fig. 5) with the delineation of updated areas. In the course of the project (by the end of 2024), the map should be supplemented with a layer that will also provide information on deficit areas from a water management point of view. To finalize the map, the materials showing the individual future simulations were also used.
Fig. 6 shows mean absolute changes in precipitation totals for the summary of simulations according to SSP scenarios and for partial time steps. Absolute mean changes in runoff heights are shown analogously in Fig. 7. An increase in precipitation totals can be observed in most simulations which, however, often cannot compensate for the increase in evapotranspiration primarily caused by increased air temperature. This has an impact on runoff levels.
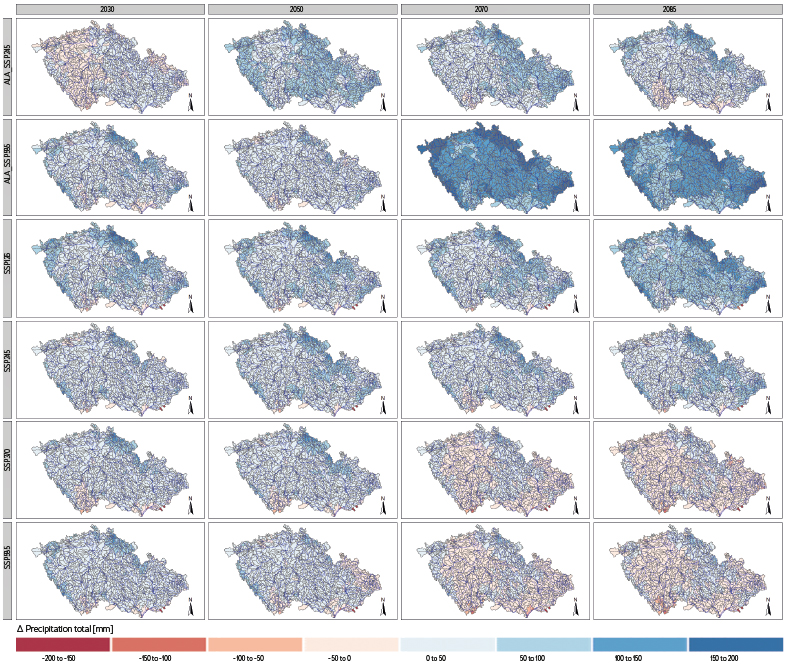
Fig. 6. Absolute changes in precipitation based on individual climate model simulations
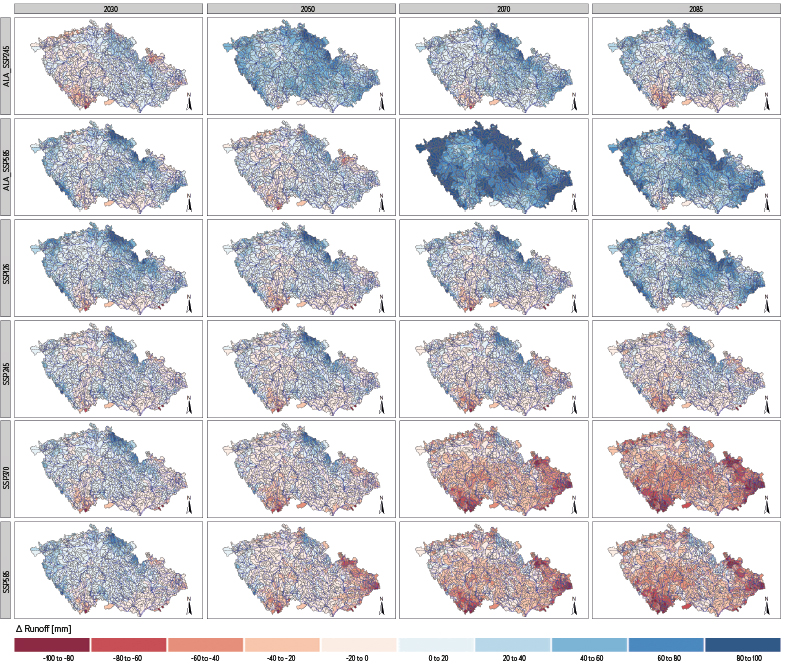
Fig. 7. Absolute changes in runoff based on individual climate model simulations
Fig. 8 shows the deficit areas. The grey polygons delineate deficit areas established at the beginning of the “Water Centre” project implementation. A large dispersion is evident here, especially for more distant time horizons. For this reason, simulations for 2050 (also set as the reference year of the project) were considered for updating the areas.
 Fig. 8. Evaluation of deficit areas based on individual climate model simulations (grey polygons indicate the non-updated layer of deficit areas)
CONCLUSION AND DISCUSSION
The goal of the project described above was to provide up-to-date information on the possible impacts of climate change on hydrological balance characteristics (runoff, base runoff, partial water reserves, evapotranspiration, etc.). The article itself does not describe in detail the individual methodological steps of the evaluation procedure, but rather the final synthesis of the data outputs of the given issue.
The HYMOD-KZ website at https://shiny.vuv.cz/HYMOD-KZ/ provides detailed results of hydrological modelling and analysis of the catchment area hydrological balance. This tool can be crucial for water management professionals as it provides data on different scenarios of climate change impact on water quantity. These data can be used for further follow-up studies, not only of a research nature. However, a significant variability of changes can be observed within the outputs, which are mainly determined by the input climate data (especially individual forecasts of precipitation totals and their temporal distribution during the year) and uncertainties in the simulations of the hydrological model, which is calibrated on the basis of available input data. A lot of studies and research deals with the calibration strategies themselves. Future research could be enriched by the use of different hydrological models and the development of ensemble solutions based on hydrological simulations with the same data inputs.
Acknowledgements
This article was created on the basis of research carried out as part of research project No. SS02030027 “Water systems and water management in the Czech Republic under conditions of climate change” (“Water Centre”), work package 1 and sub-goal 1.2. Data from the project No. SS02030040 “Prediction, assessment and research on the sensitivity of selected systems, the influence of drought and climate change in the Czech Republic” (PERUN) were also used for the modelling itself.
The Czech version of this article was peer-reviewed, the English version was translated from the Czech original by Environmental Translation Ltd.
