ABSTRACT
This article presents the results of the sub-objective “Scenarios of future water demands for different climate scenarios and individual sectors of water use” (DC 1.1). Which is part of TA CR project No. SS02030027 “Water systems and water management in the Czech Republic and climate change conditions (Water Centre)” and is a sub-part of the WP 1 “Prediction of the development of water resources security in the Czech Republic until 2050 in regions depending on climate change”. The project was implemented between 2020 and 2024 and involved the following organisations: TGM Water Research Institute (TGM WRI); University of Chemistry and Technology in Prague (UCT); Czech Technical University in Prague (CTU), Faculty of Civil Engineering; CzechGlobe – Global Change Research Institute of the Czech Academy of Sciences (CAS); Czech University of Life Sciences in Prague (CZU); and Charles University in Prague, Faculty of Science – as a subcontractor. This article deals with the projection of future water demand up to 2050 through sectoral analyses and forecasts. The solution uses different scenarios that consider factors such as population growth, economic development, climate change, technological advances and policy decisions, and focuses on water demand for the following sectors: agriculture, industry, energy industry, and households. It also assesses the potential impacts of different scenarios on the availability of water resources. The results show that in some regions, depending on the scenario considered, there may be a significant increase in water demand, which could lead to water scarcity and therefore require the implementation of new strategies for efficient water management. Conversely, in some regions, a decline in economic activity and population migration may lead to a reduction in water demand. The paper further describes the potential uncertainties and variables affecting the prediction of future water demand, while highlighting the importance of sectoral analysis for understanding future trends in water management.
INTRODUCTION
Water is an essential resource for life on Earth and at the same time plays a key role in all areas of human activity, from agriculture to industry, electricity and heat production to household operations. With climate change and changing water demands from different sectors, the issue of future water demand is becoming increasingly urgent. The issue of the future availability of water resources is a complex topic that includes a number of key aspects, such as changes in the distribution of precipitation in time and space (some areas may experience periods of drought, others periods of torrential rain), increase in temperature, increase in water evaporation from vegetation and water bodies, economic development and industrialization requiring more water for industry and energy industry, increasing population living standards and the associated higher water consumption in households, and the growing demand for water in agriculture to ensure food security. The basic prerequisite for solving the aforementioned issue is to obtain information about the future demand for water in various sectors and its distribution across the Czech Republic, with a subsequent comparison with future available sources. The result should then be a more efficient use of water in agriculture, industry, energy industry and households, associated with the development of technologies for water treatment and recycling, building water infrastructure for water retention and transport, and also with the improvement of forecasting systems for water management. It is a key integrated approach that considers all the aspects mentioned above and seeks levelled off solutions to ensure sustainable management of water resources in the future. As this is a relatively extensive issue, it was dealt with by a wider team of experts of various specializations divided into several teams focused on a certain area of water demand estimation. Based on available data and forecasts, the development of water demand in the coming decades will be predicted. Based on these findings, the follow-up activities of other work packages within the “Water Centre” will determine what strategies can be implemented to ensure sustainable and equal distribution of this valuable resource.
Water demand analysis for industry
METHODOLOGY AND SOURCES USED
The goal of the researchers from UCT was to analyse the current demand for water in industry in the Czech Republic and to obtain data for the quantification of future demand. The input was data on registered surface and groundwater abstractions and wastewater discharges for 2009–2019, based on Decree no. 431/2001 Coll., managed by the State River Basin Authorities. These are data on direct abstractions and discharges reported by individual entities; therefore, they do not include information on the use of water from public water supply systems and the discharge of water into public sewers.
The data was divided into three groups:
- Aggregated data on annual discharge/abstraction volumes for individual sectors for 2009–2019 related to regions and districts that became the basis for monitoring development and trends.
- Detailed data on the most important entities in water management in individual sectors. The so-called TOP 7 – detailed data for entities reporting the largest volumes of water abstracted and/or discharged in the given sector. Each of the selected parameters (surface water abstraction, groundwater abstraction, wastewater discharge) was evaluated separately, with 2019 being the most important year.
- Complete unclassified data on abstraction and discharge (i.e. for all sectors, not only industry) for 2009–2019, used primarily in the checking for and tracing of possible discrepancies.
The aggregated data was processed in both tabular and graphical form, so that it was possible to determine the most important sectors for individual territorial units and to monitor possible trends in the demand and consumption of water. The initial analysis was carried out at the level of the Czech Republic and its regions, then it was extended to districts. In addition to annual abstraction (or discharge), data on seasonal fluctuations were also processed, i.e. abstractions in individual months.
SUMMARY OF RESULTS
It was found that in the case of surface water, the chemical industry is the largest user in the Czech Republic, followed by paper production, metal processing, and mining. Groundwater abstraction is generally associated primarily with mining and food industry; other sectors show significantly lower values. There are also big between regions; at the regional level, the largest industrial surface water abstraction was recorded in the Ústí Region, mostly involving chemical and paper industries. Regarding groundwater, the Moravian-Silesian and Central Bohemian Regions show the highest values, with the majority in the Moravian-Silesian Region associated with mining.
Although it is a generally accepted fact that industrial demand for water in the Czech Republic has been decreasing for a long time, this rule cannot be applied as universally valid under all conditions. Data analysis shows that there are differences both between industries as a whole and between individual regions. However, despite these differences, it can be stated that the prevailing trend toward the end of the analysed period 2009-2019 was balancing the volumes of water abstracted, without extreme fluctuations.
At the district level, the resulting progress of abstraction and discharges is in many cases much more fluctuating, often without clear trends. This is partly due to the fact that the sources of discrepancies found in regional analysis are more pronounced in smaller territorial units, and partly due to the fact that at the district level the number of entities of one industry is limited. Sometimes an industry is represented by a single enterprise whose operation defines the entire progress of time. It is in such cases (i.e., there is only one important water management entity in an area) that it is possible to observe the convergence of trends at the regional and district level. A typical example is the Ústí Region and the Litoměřice District, where the values of abstraction and discharge of paper industry are basically determined by a single company, Mondi Štětí, a. s.
As part of the research, the seasonality of abstraction was also determined. The analysis confirmed that there are differences not only between sectors, but also within individual sectors. Some sectors show more or less levelled off consumption throughout the year; for others a decrease in the summer is characteristic, indicating regular summer shutdowns, or other reasons for the abstraction regime reducing abstractions in the summer period. In contrast, there are companies showing abstraction peaks in July and August. An important finding is the fact that recorded monthly deviations can vary significantly from year to year for a given entity.
CONCLUSIONS AND THEIR UNCERTAINTIES
Industry in the Czech Republic is still diverse, export-oriented, and not subject to central planning. It is therefore influenced by a number of factors (economic, social, political; not only at the local but also international level), which are difficult or even impossible to predict with sufficient accuracy. More detailed outlooks for individual sectors as a whole are not available, and obtaining information about specific entities is complicated.
With regard to the above-mentioned facts, a simplified approach was chosen based on a combination of monitoring current trends in water abstraction and discharge, with an effort to obtain at least a general idea of the development of individual industries until 2050.
The results of data analyses can be summarized in a relatively simple statement: as the size of the analysed territorial units decreased, the volatility of the data series increased and clear long-term trends disappeared. In contrast, possible seasonal fluctuations became more apparent.
Based on the results achieved, it was decided that the issue of future water demand in industry will not be dealt with by predicting changes over time, but by setting three fixed levels which will enable the comparison of realistically available water resources at a given time. The starting point for their determination was the abstraction analysis at the regional level. This approach can be used not only for annual, but also for monthly values, to capture fluctuations in abstraction during the year.
Baseline value
Baseline values are based on the assumption that industrial demand for water in the future will be similar to the present, or by the end of the evaluated period 2009–2019. The value for each sector will be calculated as an average of four years, which were selected based on data evaluation at the regional level. In most cases, it concerns years 2016–2019, when Czech industry was in good shape and the most common trend in water abstraction was a more or less steady state. For industries or regions where there were significant fluctuations in these years, development of water demand was analysed in more detail and other years were selected for calculation (Fig. 1).
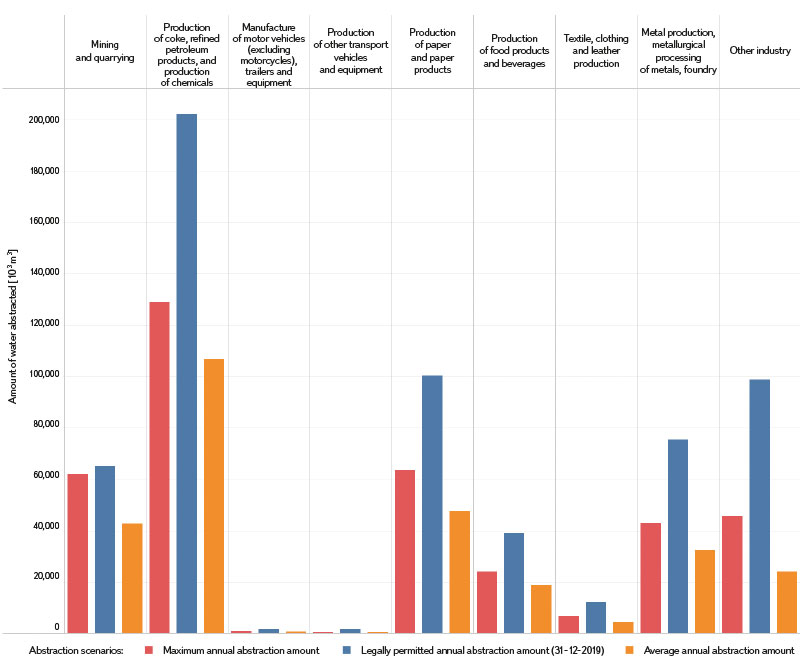
Fig. 1. Surface and groundwater abstraction scenarios for industry up to 2050 based on data from 2009–2019 in sub-sectors
Maximum value
The largest volume of abstracted water recorded in 2009–2019 will be used as the maximum value of future abstractions. This provides a realistic estimate of possible positive deviations from the baseline (Fig. 1).
Critical value (must not be exceeded)
The data contains information not only on abstraction and discharge, but also on maximum permitted volumes. In the analysed period 2009–2019, the limits for groundwater and surface water abstractions were not fully used, and therefore provide a reserve that is at least theoretically available to the relevant businesses. It is a realistic assumption that the limits for specific entities will not be increased in the future, and thus determine a critical limit for the use of water resources, which can be compared with the expected future demand (Fig. 1).
The above-mentioned approach naturally brings with it certain risks and uncertainties:
- Insufficiently clear or misleading trends
Total demand for water in industry in the Czech Republic has been decreasing for a long time; however, simply projecting this fact into the future could lead to completely wrong conclusions (theoretically to almost zero water demand). Conversely, any growth observed in a certain industry and region cannot simply be extrapolated into the future based on a mathematical calculation. Even the steady state observed in a number of industries in recent years does not mean that there will be no fundamental changes in the future. - The issue of transferring trends and forecasts to a lower level of territorial units or individual entities
Trends valid at the national or regional level may not be valid for a smaller area. The project envisages modelling water management balance at the level of small units – hydrogeological districts and water bodies, where it can be expected that the situation will also be assessed at individual abstraction points, i.e. individual entities. In such a case, it will largely depend on local conditions. - Creation or disappearance of entities
A prediction based on the analysis of historical data cannot, in principle, work with the possible demise of the business (in the sense of ending production) and especially with the construction of a new one (primarily on so-called green field). - Suitability of authorized abstraction
As mentioned earlier, permitted abstraction of surface and groundwater will serve in the prediction of water demand as a limit that future development must not exceed. Given that in some cases the permitted values are significantly higher than the real state, it is not guaranteed that the current yield of the relevant water resources allows them to be achieved.
Water demand for agriculture: Irrigation water demand – from the point of view of irrigation technology
METHODOLOGY
The aim of the CTU working group was to try to outline the development of irrigation in the Czech Republic by 2050 and to hypothesize what technology will be used and whether the irrigable area will increase or decrease; subsequently, in cooperation with project partners, determine how many water resources for irrigation and other sectors of human activity would need to be secured in this time horizon in individual regions.
An analysis of the available documents describing the current state was used [1–4]. It mainly concerned information on the structure of crop production and on the technical parameters of irrigation – i.e. where it is technically possible to irrigate crops with regard to the availability of resources and infrastructure (irrigable areas). The irrigation detail enabling efficient irrigation was also dealt with (minimization of water loss and accurate dosing of irrigation water). For its current use for crop irrigation, the values of the loss coefficients K1 and K2 were specified; see Tab. 2 (CzechGlobe). For the prediction of water requirements, the long-term trend of the development of climatic parameters determining the demand for additional irrigation for individual crops in the event of changes in agroclimatic areas is also considered (Czech Statistical Office – CZSO and the Crop Research Institute – CRI).
Current data on irrigation (irrigated areas) was taken from the ISMS database (SOWAC-GIS geoportal map project). Data from the Land Parcel Identification System (LPIS) were used for crop occurrence [5, 6].
An analysis of the irrigation abstraction database (TGM WRI) was carried out for individual catchments, and the ambiguities found were discussed with representatives of the State River Basin Authorities [7]. The database provided the amount of surface and groundwater currently abstracted for irrigation for 2014–2021; the data was subsequently processed for individual sub-basins and surface water bodies [8].
By determining the demand for water for individual crops (data from CZU) [9], an estimate was subsequently created of total demand for irrigation water for individual surface water bodies and quantification of the necessary water sources for irrigation. When predicting future water abstraction for irrigation, updated water losses forced by irrigation technology are already considered [10], and all calculations and estimates were made for predicted climatic conditions.
RESULTS
For selected relevant data from the TGM WRI database, the annual volume of water abstracted for irrigation in 2014–2021 was in the range of 18–31 million m3, which accounted for roughly 1.4 % of total annual water consumption in the Czech Republic. The biggest amount of irrigation water was abstracted in 2018; the amount has been gradually decreasing since. Water was abstracted mainly from surface water, with less than 10 % reported from groundwater. The largest amount of irrigation water for the analysed period (45 % of the total average amount) was abstracted in the Dyje catchment. The rate of use of the monthly amount of water legally abstracted (in the months of the general growing season) was recorded partly inaccurately; for example, collectively for the growing season, by wrong reading of the water meter, or ambiguously in the case of groundwater abstraction. In some cases, the permitted values were exceeded (around 30 %).
The provided soil water balances of individual crops (CZU) were evaluated; consequently, the water demand for individual surface water bodies was recalculated for the selected crops and the considered periods.
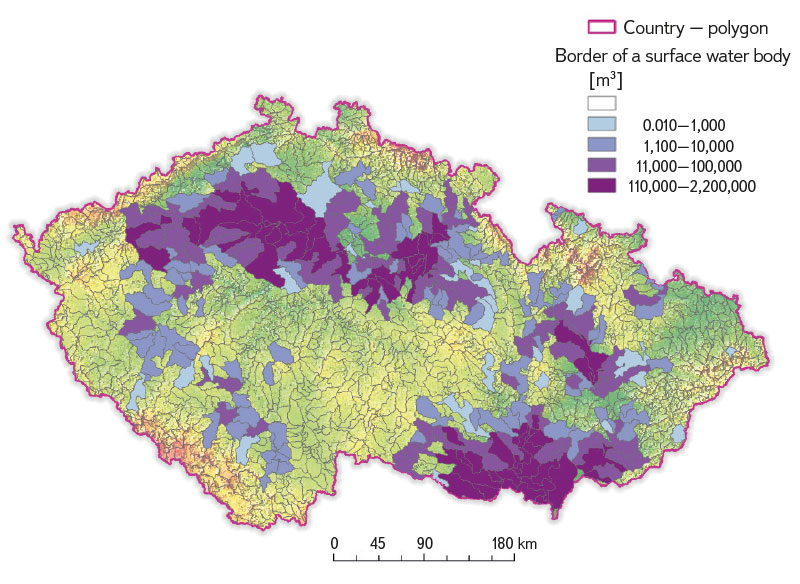
As part of determining scenarios for irrigation water abstraction, combinations of irrigation water demand for “hop fields”, “vineyards”, “orchards”, “arable land”, and “permanent grassland” were created for each surface water body for irrigated and non-irrigated areas in the “average growing season GS”, in “Dry season – sensitive growing season SGS” and as “horizon 2050 prediction for growing season GS” [11–15]. All results are part of the overall CTU report in tabular digital form and an example of the graphical display of irrigation water demand for individual surface water bodies in the “forecast GS” variant; see Fig. 1.
- “Average 12 years GS” variant describes the current state calculated from real measured values 2010–2021; it can be considered as the lowest demand of water for irrigation.
- “Dry SGS” variant was calculated for sensitive growing seasons as the average of the two extreme years 2015 and 2018, representing the potentially highest irrigation water demand in a sensitive growing season.
- “Forecast GS” variant estimates future demand for irrigation water for the vegetation period of the given crop (GS) from the simulated values of soil water balances 2022–2050.
 Fig. 2. Illustration of irrigation water requirements per growing season in m3 in individual UDPs, variant „forecast GS“. (Source: CTU)
UNCERTAINTIES
Considering the ambiguities of the recorded values of irrigation abstraction, the rates of use of the monthly amount of water legally abstracted were discussed with the employees of the State River Basin Authorities. Calculations of irrigation water demand are made on the basis of current knowledge and currently available data. Clearly, even these results are burdened with uncertainties; for example, there is a lack of updating of the database of actually irrigated areas and their connection to abstraction points. When calculating the amount of water for irrigation, uncertainties arose due to the inconsistency of the defined LPIS categories (“hop fields”, “vineyards”, “orchards”, “arable land”, and “permanent grassland”) with the provided soil water balances of individual specific agricultural crops (see CzechGlobe). Uncertainties also exist in the socio-economic area because the structure of crops, as well as the decisions of economic entities to support the construction and subsequent use of irrigation, are significantly influenced by the economy, subsidy titles, and the common European market. In comparison to the previous ones, the uncertainties in the area of regional climatic development are also lower (although not negligible).
CONCLUSIONS AND RECOMMENDATIONS
The analysis of the irrigation abstraction database determined the used amounts of water in individual river basins, searched for and named ambiguities in the entries of values.
Analysis of irrigation technologies in the Czech Republic and estimation of their irrigation water losses enabled calculation of the approximate maximum amount of water needed for the irrigation of typical cultures “vineyard”, “hop fields” and “orchards”, including a possible extrapolation to the scenario of covering the entire area of these cultures with irrigation. The indicative amount of water needed to irrigate “arable land” and “permanent grassland” was calculated; it is clear that irrigation on arable land will be decisively concentrated on vegetables and early potatoes, and on permanent grassland on meadows for the production of fodder for dairy cattle. Development towards full irrigation is not realistic here – it was only applied where irrigation is already in place (which was considered an indicator of the fact that irrigated crops are grown there). This fact was verified according to CZSO data – which, however, are only available at the district level until 2014.
Without being able to make a realistic balance of the availability of water resources for individual irrigated areas, it is quite obvious that groundwater should not be massively used for irrigation in critical areas, as it is valuable water that should be reserved for drinking purposes. In addition, there will obviously be simultaneous occurrences of the demand for irrigation (longer periods of heat and drought) and, simultaneously, low flows in watercourses (longer periods of drought and heat). Water demand will thus be covered only by the construction of additional reservoirs, or by modifying the handling regulations of existing reservoirs (if they have free capacity).
Implementation of irrigation mathematical models can help (e.g. the AQUA CROP model, registered by FAO). These methods will rather help to optimize the size and timing of irrigation doses; however, they do not influence the overall water balance.
We can see that the state records a large amount of data and information, but often without a concept, in different places and without mutual continuity. Therefore, it is recommended to:
- link the information from the Ministries for the purpose of efficient management of water and other resources.
- carry out a detailed inventory of land in the “irrigated” and “irrigable” category and introduce these as parameters into the LPIS database.
- separate the category “water for irrigation” in the records of water abstraction and assign irrigated land to individual sources – this can also be done in the LPIS or in the ISMS databases.
Water demand for irrigation from the point of view of plant demand modelling: preparation of scenarios for the development of climate parameters – selection of models
Based on analysis within the excellent research projects of the Operational Programme Research, Development and Education – Sustainability of Ecosystem Services (OPVVV SustES) and the Operational Programme Jan Amos Komenský – Advanced Methods of Emission Reduction and Sequestration of Greenhouse Gases in Agricultural and Forest Landscapes (OP JAK AdAgriF), the CzechGlobe team systematically tested the suitability of methods for the preparation of usable and robust data for estimating future climate developments. The team considered the fact that the latest set of intercomparison projects of the Coupled Model Phase 6 – Global Circulation Model (CMIP6 GCM) includes models with different degrees of spatial detail. Most simulations of climate development in the 21st century have a horizontal spatial resolution of around 100 or 250 km. There is also a small subset of Global Circulation Models (GCMs) with a resolution of around 50 km, but their simulations end in the mid-21st century. Individual GCMs also differ in the complexity of the descriptions of events in the climate system, the methods of parametrization of smaller-scale phenomena, as well as the formulation and numerical solution of basic physical equations. It is natural that the simulated climate diverges to a certain extent from reality and this difference changes in space, time, or across physical quantities. After five years’ research, GCMs that best affect the climate of Central Europe were preferred for simulations of the future Central European climate. Simultaneously, it is necessary to ensure that the preferred GCMs (which are only a subset of all available GCMs) affect the future climate development in the same way, with the same degree of uncertainty, as the full set of all available GCMs. That is, for the selected subset of GCMs not to represent models that, under the same conditions, expect e.g. higher increase in temperature (or changes in precipitation, wind, sunshine, etc.) than models that are outside the selection. The narrowing of the set of climate models was carried out by the procedure proposed by Meitner [16].
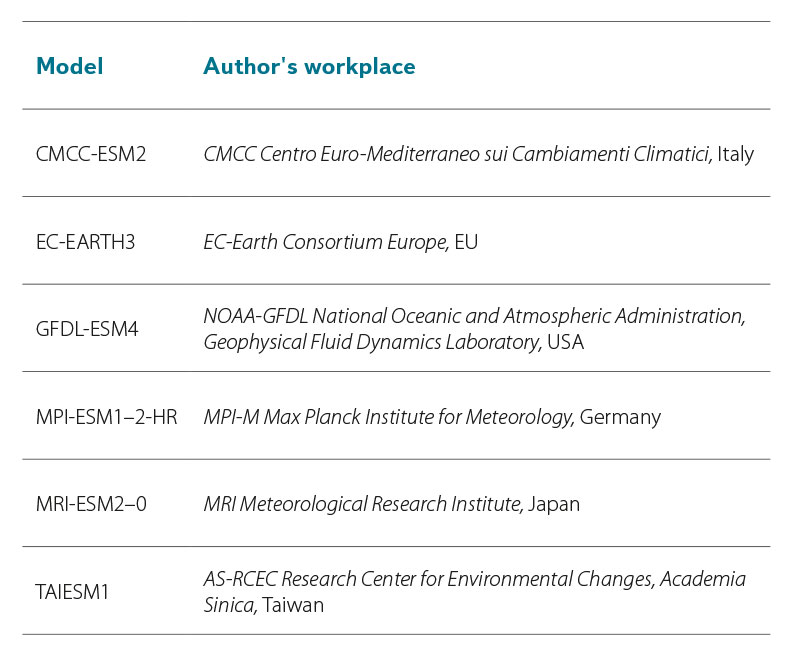
In accordance with the methodology, from the set of around twenty CMIP6 GCMs (which had all the necessary elements and emission scenarios available), those models that were not able to reliably simulate the Central European climate of the recent past were excluded based on validation. From the other models, six GCMs with a resolution of 100 km and representing all four emission scenarios were selected so that this narrower selection represented the entire original set of models with its statistical properties, but enabled working with a smaller number of simulations. GCM selection was done with regard to all basic meteorological elements, which are further analysed, or used for the calculation of reference evapotranspiration and soil moisture by the SoilClim model. The model selection, together with the available climate change scenarios, is shown in Tab. 1 below. GCMs with finer spatial resolution (100 km versus 250 km) were preferred.
Tab. 1. Overview of models and country of origin; the nominal grid size in the equatorial region was approximately 100 × 100 km, and simulations of all models were available for all socioeconomic scenarios (SSP – see below)
Climate change scenarios serve as a source of so-called boundary conditions for GCMs and reflect various possible future trajectories of global development not only from the point of view of emissions or resulting concentrations of greenhouse gases in the atmosphere, but also in terms of various economic and social developments on the planet. The latest sixth assessment report of the IPCC (AR6) (available at: https://www.mzp.cz/cz/souhrnna_zprava_ipcc) works with scenarios of socioeconomic development, known as Shared Socioeconomics Pathways (SSP). In current nomenclature, the SSP code includes both the path of socio-economic development (first number) and the predicted impact of anthropogenic emissions on the greenhouse effect enhancement in tenths of W. m-2 (watts per square metre – energy flow density).
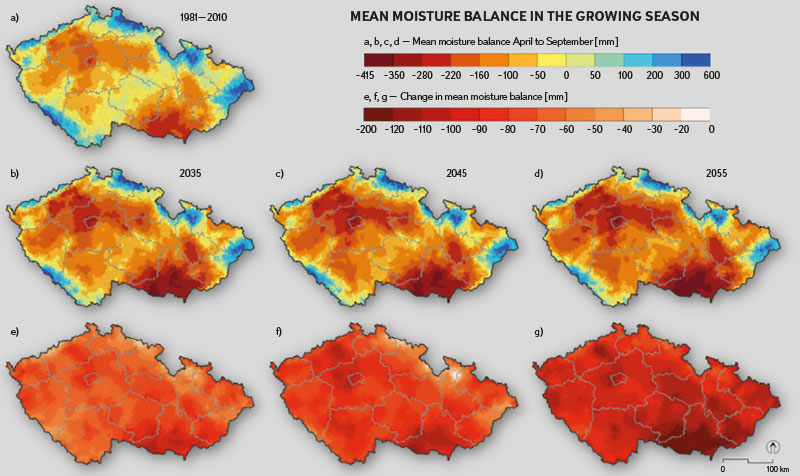
Fig. 3. Illustration of the difference between the sum of precipitation and reference evapotranspiration in the so-called warm half-year (April–September) for the reference period (a) 1981–2010 and the periods (b, e) 2020–2050, i.e. 2035, (c, f) 2030–2060, i.e. 2045 and (d, g) 2040–2070, i.e. 2055, for basin level IV. Maps b–d show the change in absolute value, maps e–g show the nature of the climate signal, i.e. the relative change
In simple terms, the individual climate change scenarios used for input into GCM simulations can be interpreted as follows:
- SSP1–2.6: sustainability; a path of development with the greenhouse effect enhancement by up to 2.6 W. m-2 compared to the pre-industrial period,
- SSP2–4.5: middle of the road; degradation of environmental systems, but some improvements regarding resource and energy use leading to the greenhouse effect enhancement by up to 4.5 W. m-2,
- SSP3–7.0: regional rivalry; conflicts allowing little economic development and the greenhouse effect enhancement by 7.0 W. m-2,
- SSP5–8.5: fossil-fuelled development; potential to enhance the greenhouse effect by up to 8.5 W. m-2.
Preparation of climate scenarios
Unless we are concerned only with the relative change of meteorological elements, GCM outputs cannot be used directly. They are burdened with systematic error (e.g., in Central Europe – an underestimation of temperature by 1 °C, or overestimation of precipitation by 25 %, etc.), which must first be removed by so-called bias correction. Alternatively, it is possible to work with climate change resulting from climate model simulations, which is linked directly to observed data. The second approach is referred to as the “incremental method” or “direct modification” and is commonly used in the Czech Republic for modelling the climate change impacts (e.g. on hydrological balance) as there is greater robustness using this method than when using climate model simulations with systematic error correction (so-called bias correction). To use the “incremental method” in the daily step, it is advisable to apply transformations that consider not only changes in averages, but also variability. This is made possible, for example, by the Advanced Delta Change (ADC) method. Thanks to the ADC method, the change in variability can also be included in the transformation. This simply means that the extremes can vary differently than the average, which correctly reflects our experience in the real world. When deriving precipitation changes from the climate model, the ADC method also considers systematic simulation errors, which may not be linear. Further details can be found in van Pelt et al. [17]. The development of the basic set of scenarios using the ADC method, as well as the selection and analysis for the purposes of this project, were carried out iteratively and in close cooperation between the CzechGlobe, CZU, and TGM WRI teams.
These scenarios obtained as part of the OPVVV SustES and OP JAK AdAgriF projects were adapted for the teams at the “Water Centre” into a form suitable for the model tools used here and tested in detail. Although the actual preparation of scenarios and data analysis was not directly part of the contract for “Water Centre”, it is necessary to mention the basic description of the methods. At the same time, the individual simulation runs within the cascade of irrigation and hydrological models are unique and used only within the “Water Centre”.
With regard to the interpretation of results, in addition to the reference period 1981–2010, we are working with 30-year time windows for the future climate: 2020–2050
(referred to as “2035”), 2030–2060 (“2045”), and 2040–2070 (“2055”). The periods overlap each other. Within these time windows, statistical characteristics (including extremes) for the given period can be evaluated. Similar to climate model simulations, it does not make sense to analyse and present individual days or years, but only statistics for the entire period. Long-term trends can then be evaluated by connecting individual (sliding) periods in future climate. An example of the output for the water balance (i.e. difference between ETref and precipitation) in growing season is shown in Fig. 3.
Analysis of water demand for crop production
As part of the project, the SoilClim model was used, among other things, for drought monitoring and forecasting in the www.intersucho.cz system, which is based on the recommended methodology of FAO [18] and ASCE [19]. The SoilClim model outputs for the climatological water balance were compared in the past for greater robustness with the model of the Czech Hydrometeorological Institute AVISO with goodness of fit (e.g. Štěpánek et al. [20]). Model estimates of water demand in the SoilClim model were made for each grid with a resolution of 500 × 500 m across the entire Czech Republic based on daily meteorological data, data on inclination and exposure of the land (for considering the radiation and energy balance), data on the retention capacity and soil depth, and the possible influence of groundwater. In individual cases, the calculation was limited only to grids with agricultural land, or to irrigable grids. The dynamics of vegetation growth in the SoilClim model took into account the connection of plant development (but also the date of sowing/planting/sensitive periods/harvest) to weather. Key factors influencing water demand (e.g. variable leaf area or rooting depth) are considered and change dynamically during the season. For the cases of calculating water demand in the expected climate, the CO2 effect on the water regime of plants is also included. On the basis of previous studies dealing with irrigation in our country and a search of world specialist literature, the key parameters of vegetation cover were determined, which represented a total of 20 crops/cultures, some of which were assessed in different regimes (e.g. orchards with bare soil or active growth in intermediate rows). It was thus possible to determine the relative water demand of individual cultures. The methodology includes a change in the onset of phenological works, changes in sowing and harvesting dates, and thus also reflects a change in the seasonality of the need for irrigation.
When determining the demand for soil water, all calculations were performed at the level of individual grids in a daily step, and the irrigation dose was applied whenever soil water content of a root zone fell below 30 % of retention capacity, i.e. the limit was reached when water is relatively difficult for plants to access and their growth is subsequently significantly limited by lack of soil water. With this “maintenance” irrigation, the survival of the culture is guaranteed. A special regime was used for weeks when the value of the irrigation efficiency factor taken from ČSN 75 0434 for the given week and the given crop indicated an efficiency factor higher than 40 (which means a significant influence of irrigation on economic yield). In these cases, soil water content of the root zone was maintained at values of at least 50 %. Such type of irrigation would be relatively very effective.
Final iteration of determining irrigation sources and demands
Currently, the final determination of soil moisture demand is underway by the cascade of SoilClim and BILAN models, using the knowledge obtained in cooperation with WP1 partners. Currently, calculations of the possible irrigable area for the following selected commodities were performed for each surface water body: spring barley, winter wheat, maize, winter rapeseed, early potatoes, apples – bare surface, apples – active surface, cherries – bare surface, cherries – active surface, apricots – bare surface, apricots – active surface, peaches – bare surface, peaches – active surface, vineyards, hop fields, strawberries, garlic, onions, carrots, peppers, cucumbers, cauliflower, cabbage.
After all the calculations were done, this soil moisture demand was determined, and in the next step, the TGM WRI team worked with the data not only for the current climate, but for the most current climate change scenarios based on the CMIP6 model suite. Based on the provided climate data and soil moisture from the SoilClim model, TGM WRI determined the available water resources for each surface water body for current and future climate. TGM WRI, in agreement with CzechGlobe, carries out calculations in variants, namely in the variant that takes into account the fact that water is managed in the entire system (that is, we have water available from reservoirs and from the catchment further downstream), but also in the variant where water management is limited to the given surface water body. From this available amount, for example, resources can be deducted to cover losses during the transport of water to irrigated land based on the methodology of the CTU team. Through a gradual iterative calculation, the available water in each surface water body can be divided for individual grids so that the water was first distributed to irrigable grids, according to the soil quality. If the water in the given surface water body was sufficient to cover the requirements of all irrigable grids, the irrigation water was subsequently distributed to other grids (again, according to soil quality). The result of the calculation is the potentially irrigable area, both in a normal year and in the case of a five- and ten-year drought. The calculation of irrigation demand for individual commodities is dynamic and is based on an analysis of the moisture demand of the given commodity in the root zone. Irrigation is indicated if soil moisture in the root zone drops below 0.3. The irrigable area was then determined in cooperation between CTU, TGM WRI and CzechGlobe, and simultaneously, based on CTU’s analysis, the parameters for calculating irrigation water losses were changed as the sum of losses on the line and irrigation detail.

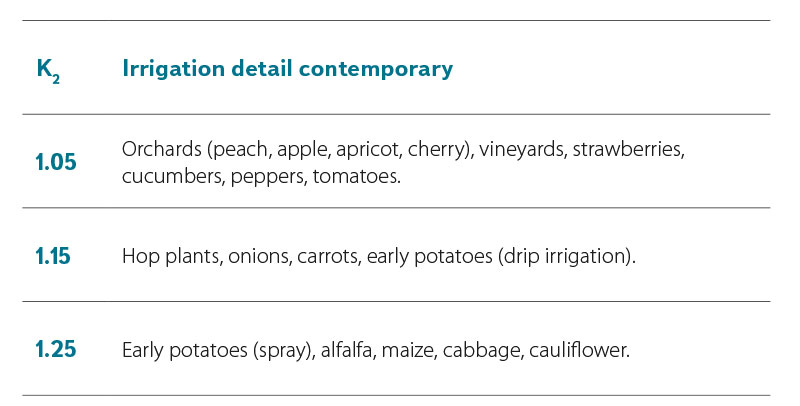
The value of K1 was defined as 0.12 (i.e. 12 %) and the value of K2 was determined according to Tab. 2. Depending on the crop, it is thus newly calculated with a loss of 17–37 %.
Tab. 2. Value of parameter K2
These changes represent a relatively significant change in the entire methodological procedure. In the final calculation, sowing procedures were applied to potentially irrigated areas according to data from LPIS based on real data from 2015–2023, processed by CzechGlobe. This made it possible to determine the “real” demand for water within the irrigation systems and subsequently to standardize the calculations for the future climate. The outputs of the joint work are being prepared for publication in an impact journal (Agricultural Water Management).
The final calculation of moisture demand thus combines innovative procedures based on the valid ČSN 75 0434, practical experience from irrigation practice and also the real composition of crops in surface water bodies with irrigation, because the specific use of irrigation so far cannot be determined otherwise. Two scenarios were created to determine irrigation needs.
The first was based on the goal of maximizing production and not allowing soil water content to drop below the point of reduced moisture availability, to which plants respond by reducing production (in simple terms). The second was aimed at not allowing soil water content to fall below values of intense water stress, i.e. a situation where crop production is significantly reduced due to a lack of water. While the first procedure aims to maximize production in conditions of limited water resources, the second procedure serves primarily to maintain the basal level of production and conserve water resources to the maximum extent possible. From the point of view of profitability, the first of the chosen procedures is suitable in situations where water resources in the catchment are sufficient, the second can be seen as an emergency scenario, as it does not guarantee producers an adequate yield; however, in a number of seasons, especially during shorter episodes of drought, it can fundamentally contribute to reducing damage with relatively less water consumption.
Simultaneously, the calculations dealt with ensuring moisture demand for the upper 40 cm variant or the profile up to a depth of 100 cm. In Fig. 4, both variants are presented for ensuring soil moisture in the corresponding volume in the upper 40 cm of the profile as a change in demand compared to the period 1981–2010 for the realistic emission scenario SPSS 2-4.5. It is clear that the entire spectrum of expected changes cannot be covered on the basis of one GCM model, nor can it be done on the basis of using only one emission scenario.
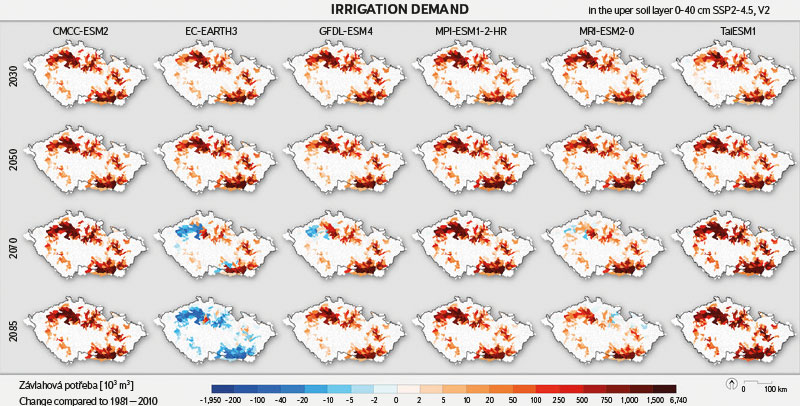
Fig. 4. Change in average annual irrigation demand for surface water bodies between the reference period (a) 1981–2010 and the periods 2030 (2015–2045); 2050 (2035–2065); 2070 (2055–2085) and 2085 (2070–2099), for the six Global Circulation Models from the CMIP6 model suite for the SSP 2-4.5 emission scenario. The set of maps shows the shift in moisture demand under production optimization efforts
The results clearly show significant variability in lines of the same GCM models for different emission scenarios, especially for the periods 2015–2045 (2030) and 2035–2065 (2050). Even in regions where, on average, there is a reduction in moisture demand, there is still a need to irrigate. However, what still remains an unanswered question is the impact of the not yet considered variant based on the estimate of the GLOBIOM-CZ agro-economic model. It shows the considerable comparative advantage of Czech agricultural production in the expected environmental conditions, and therefore the possibility to increase the profitability and market share of Czech agriculture despite climate change. That is, a situation where conditions on the world markets will be economically favourable to the expansion of domestic production, potentially even without state intervention. In such a situation, there could be pressure on using two harvests per year, which with a certain combination of crops grown today and/or a combination of suitable varieties will be possible in a few years/decades. However, the success of the second crop will be determined by the ability to harvest the first crop in time and, especially after sowing, to ensure good uptake of the second crop in the height of summer. Without additional irrigation, the latter will not be possible in most years in the warmest regions of Bohemia and Moravia.
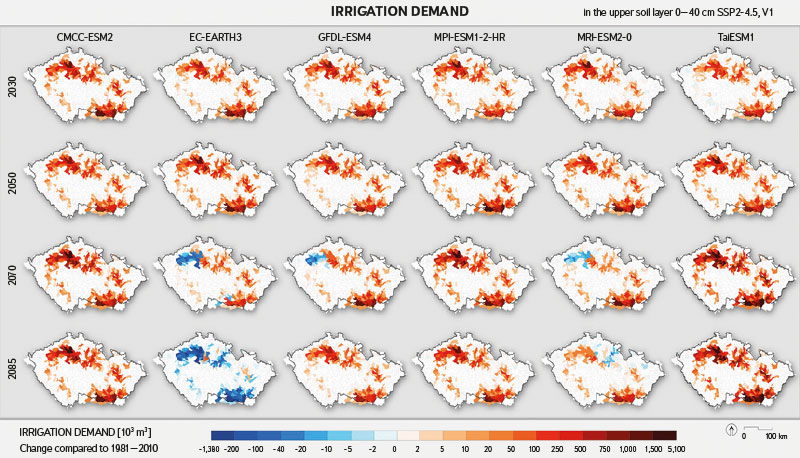
Fig. 5. Change in average annual irrigation demand for surface water bodies between the reference period (a) 1981–2010 and the periods 2030 (2015–2045); 2050 (2035–2065); 2070 (2055–2085) and 2085 (2070–2099) for the six Global Circulation Models from the CMIP6 model suite for the SSP 2-4.5 emission scenario. The set of maps shows the change in irrigation demand to avoid drought stress for crops
Water demand for animal husbandry
The aim of the CZU research, which is the development of water consumption by livestock in the Czech Republic, is to compile scenarios of animal husbandry in individual regions of the Czech Republic. The result is finding out what kind of livestock have been bred in individual areas in the last 20 years and in the future, and what their water consumption will be, both throughout the year and in individual seasons. Livestock such as cows, pigs, sheep, goats, horses, and poultry are a significant source of commodities used by humans. In connection with climate change, adaptation measures for livestock will be addressed, mainly with regard to their loading caused by the increase in spring and summer temperatures. There is also the increasing number of consecutive tropical days; such conditions cause thermal stress in animals, which is manifested, for example, in cattle by lower milk yield and weight gain [21]. Stressful conditions will occur in both stables and pastures, and animal performance will probably decrease.
Livestock have a considerable consumption of water. In addition, growing human population and demand for animal products are expected to increase demand for water and changing precipitation patterns worldwide. Therefore, the question arises whether there will be enough available water in the future and what effect the (in)availability of water will have on the possibilities of breeding livestock [22].
METHODOLOGY
As part of the data analysis, data were first collected on the number of livestock in individual regions of the Czech Republic for the period 2002–2020. The obtained tables included data on the number of cattle, pigs, sheep, goats, horses, and poultry (Tab. 3). Due to the fact that the numbers of cows, sows, and hens were additionally listed in the tables, it was necessary to adjust the data. The numbers of cows, sows, and hens were subtracted from the total numbers of cattle, pigs, and poultry, so that the resulting values correspond to the number of cattle without cows, pigs without sows, and poultry without hens.
Tab. 3. List of breeding animals (according to CSU tables)

In the next step, it was necessary to determine water consumption for livestock [22]. In the overall table, water consumption is divided for young animals, for nursing/lactating females, and for fattened animals. Minimum and maximum water consumption in litres per piece per head are always indicated, as well as maximum consumption in cubic metres per head per year. The minimum water consumption per day applies to the winter, the maximum water consumption per day to the summer. The average of these minimum and maximum values was determined as water consumption per day in the spring and autumn (Tab. 4). The average water consumption per head during the seasons (in units of l/head/season), the average water consumption per head (in the units of l/head/year and m3/head/year), as well as the maximum water consumption per head (in units m3/head/year) (Tab. 4).
Tab. 4. Water consumption by species (according to standards)
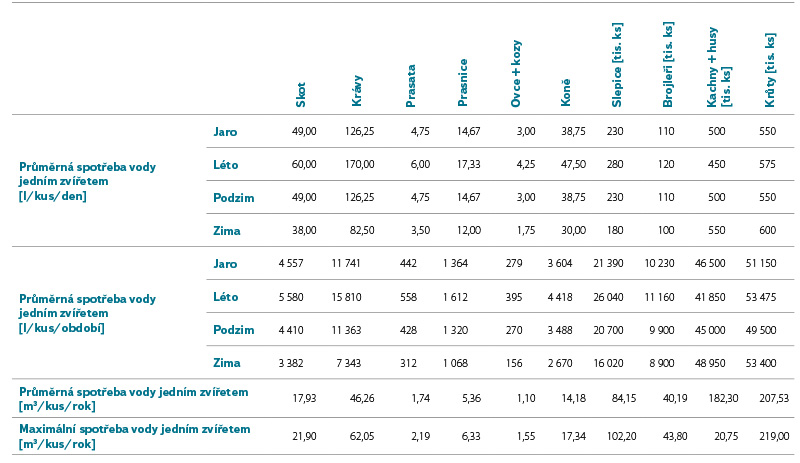
Since poultry includes not only chickens, but also ducks, turkeys and geese (which have different water consumption), it was necessary to determine the approximate percentage representation of individual animal species in the Czech Republic. For this, the Situation and outlook report Poultry and eggs was used (available at: https://mze.gov.cz/public/portal/mze/publikace/situacni-vyhledove-zpravy/zivocisne-komodity-hospodarska-zvirata/drubez-a-vejce); on its basis, the percentage representation of farmed poultry species between 2010 and 2018 was calculated. In the next step, by multiplying the number of individual species of livestock and the average (or maximum) water consumption per head of a single farm animal species, water consumption by individual farm animal species was determined; after adding up the data, the total water consumption by livestock per year was determined. This was calculated for each year between 2002 and 2018 and for each region separately. Estimates of the number of individual farm animal species and water consumption were made for 2025, 2030, 2035, 2040, 2045, and 2050 using the Forecast Sheet tool. The tool calculated the mean estimate and its lower and upper bounds. Estimates were again carried out separately for each region. In order to calculate water consumption by livestock during individual seasons, the average percentage of water consumption in these seasons compared to the whole year was first determined, which was 25.34 % for spring, 30.19 % for summer, 24.53 % for autumn, and 19.94 % for winter. Water consumption in individual seasons was then calculated based on the values found for the entire year, namely for 2005, 2010, 2015, 2020, 2025, 2030, 2035, 2040, 2045, and 2050.
RESULTS
Number of livestock and average water consumption per year for individual regions
The resulting values and conclusions always apply to the year 2050 compared to 2005.
Tab. 5. Number of animals and average water consumption (m3/year) for each animal group
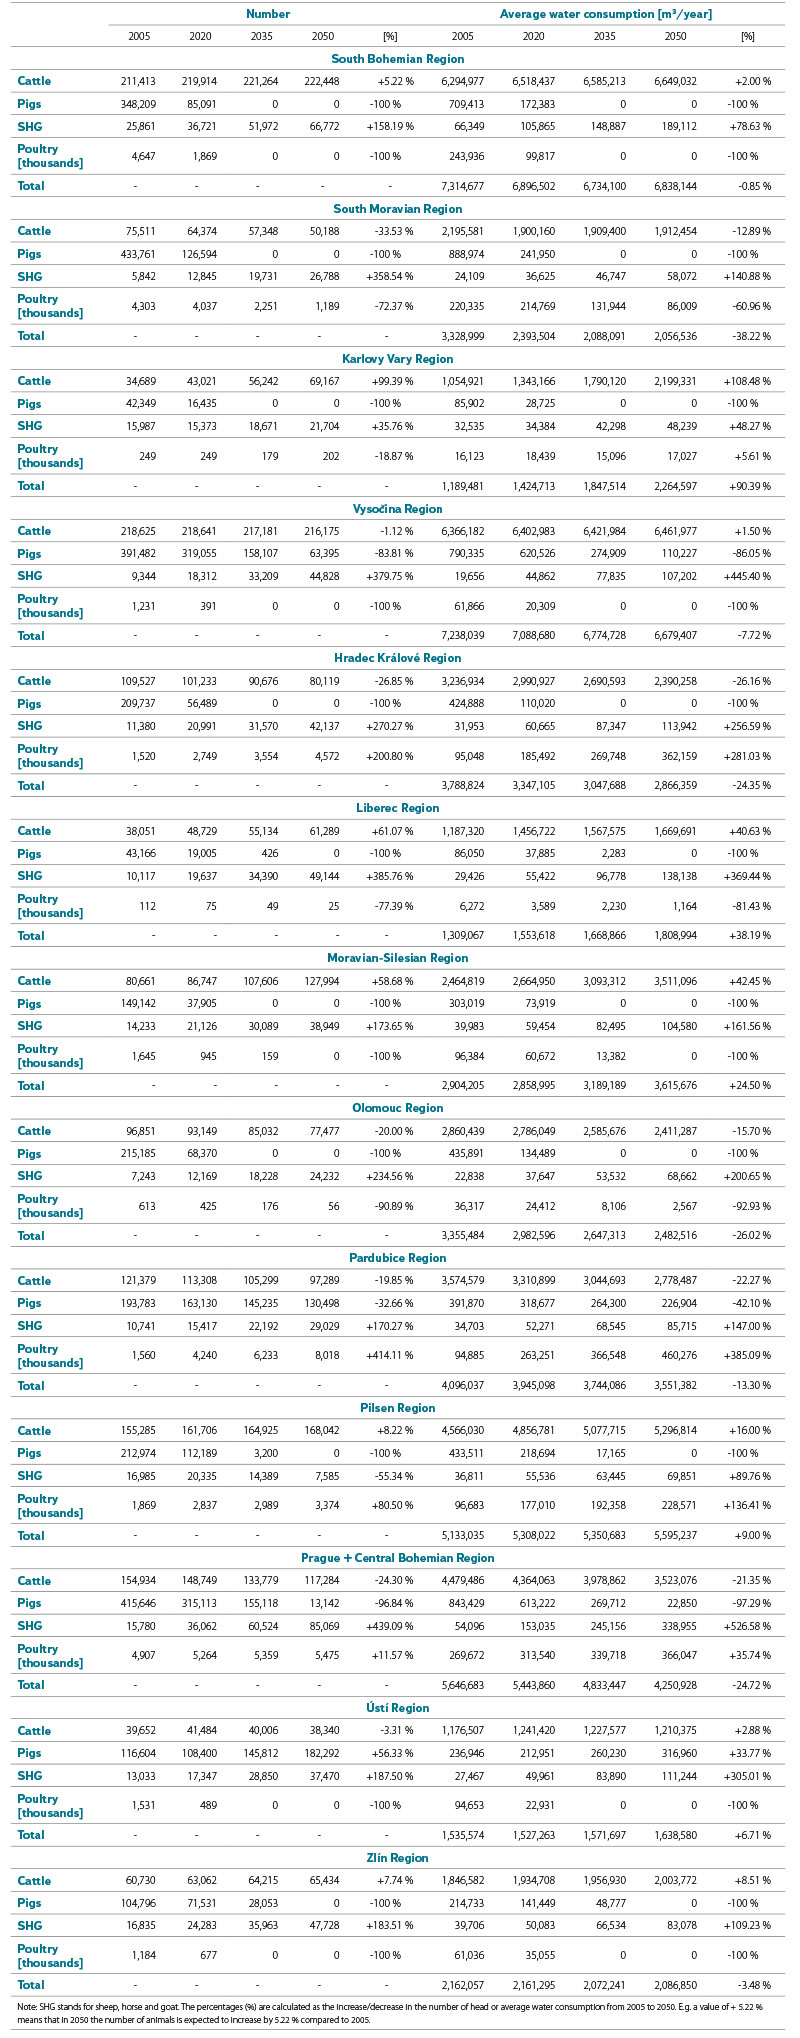
The development of water consumption by livestock was predicted for each region separately, with trends varying across individual regions. A steady state of water consumption by livestock is expected for the South Moravian, Ústí, Zlín, and Vysočina regions; a slight increase is expected in the South Bohemian and Pilsen regions; a significant increase in water consumption is predicted for the Karlovy Vary, Liberec, and Moravian-Silesian regions; a future decrease in water consumption by livestock is expected in the Hradec Králové, Olomouc, and Pardubice regions, as well as in Prague and the Central Bohemian region. Water consumption trends in individual regions are the same for both average and maximum water consumption by livestock (Fig. 6).
The results point to significant differences in water consumption between regions, which is influenced both by the specific conditions in each region and by the type and number of livestock (Fig. 6). Forecasts for 2025–2050 point to possible changes in agricultural practices that will have an impact on future water demand. A detailed description of the results was published in the methodology [22] entitled Metodika hodnocení spotřeby vody hospodářskými zvířaty v letech 2002–2020 a predikce vývoje spotřeby vody hospodářskými zvířaty v letech 2030, 2035, 2040, 2045 a 2050 v jednotlivých krajích ČR (Methodology for evaluating water consumption by livestock in the years 2002–2020 and prediction of the development of water consumption by livestock in 2030, 2035, 2040, 2045 and 2050 in individual regions of the Czech Republic), published by CZU [22]. This publication provides a detailed overview of the methodology and forecasts that were used in this study and are key for the further development and planning of water management in the Czech Republic.
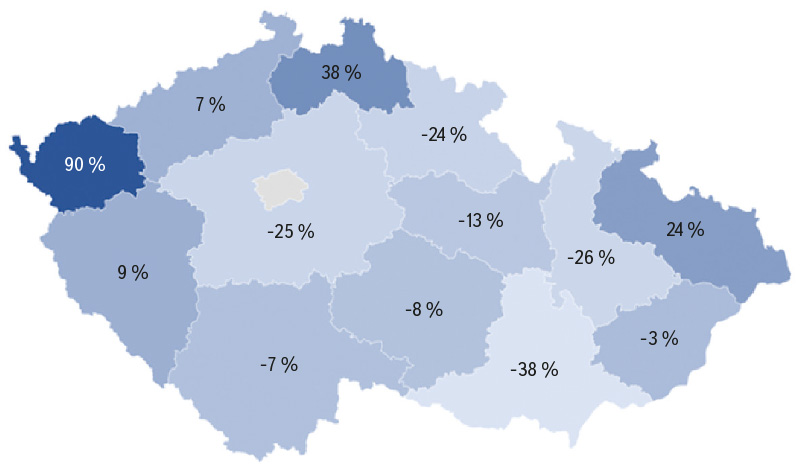
Fig. 6. Percentage change in average water consumption in individual regions of the Czech Republic in 2050 compared to 2005
CONCLUSION
As part of this analysis, the numbers of cattle, pigs, sheep, horses, goats, and poultry (hens, ducks, turkeys, geese) bred in 2002–2020 were evaluated, and their number in the following years until 2050 was also predicted (Fig. 7). Based on the livestock numbers, their water consumption was determined. By 2050, a significant reduction in the breeding of pigs and poultry is expected in most regions of the Czech Republic and, in contrast, a significant increase in the number of sheep, horses, and goats. This is probably related to the subsidies for the breeding of these animals. Livestock numbers will increase in some regions and decrease in others. Significantly higher water consumption by livestock is expected in the Karlovy Vary, Liberec, and Moravian-Silesian regions, while consumption in the other regions will probably be similar or lower. In very vulnerable areas from the point of view of water shortage, such as South Moravia and the Central Bohemian region, a significant decrease in the amount of water consumed by livestock is probable.
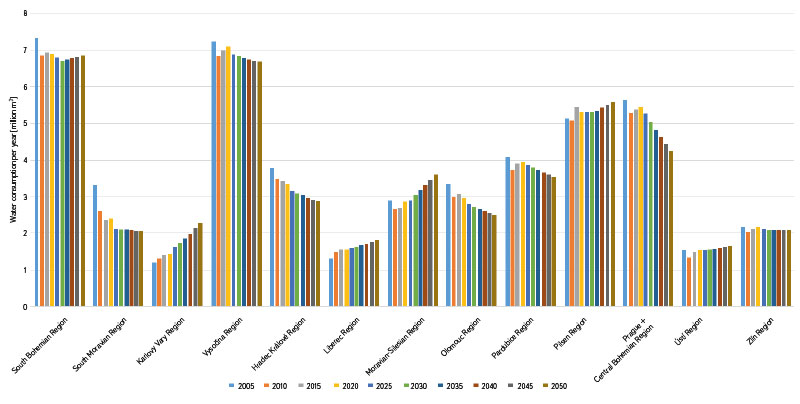
Fig. 7. Average water consumption by region 2005–2050
Analysis of water demand for energy industry
METHODOLOGY
To estimate the water demand for energy industry sector in the Czech Republic, researchers from TGM WRI used a systematic approach that includes data collection, analysis of current conditions, and prediction of future demand.
- Data collection: This included the collection of data on water consumption in various branches of energy industry and the identification of key consumption locations.
- Analysis of data on current water use in energy industry: This phase focused on the evaluation of historical data and the current state of water use in energy industry.
- Prediction of future demand: This included the prediction of future water consumption with respect to planned changes in the power generation mix, including the transition to renewable sources and technology modernization.
SUMMARY OF RESULTS
- Data collection: Data on surface and groundwater abstraction for energy industry by type of production (electricity production, heat production, gas production) for 2013–2022, recorded on the basis of Decree no. 431/2001 Coll., by State River Basin Authorities. A total of 124 locations meeting the above-mentioned conditions and also meeting the limit of abstracted water above 6,000 m3/year or 500 m3/month were selected. The abstraction points are shown in Fig. 8.
- Analysis of data on the current use of water in energy industry: The data show, among other things, that mainly surface water is abstracted for energy industry. Furthermore, it is possible to observe the downward trend in water consumption for energy industry since 2016; for example, in 2020 there was a decrease in water consumption due to the transition to circulation cooling at Mělník and Opatovice power stations. In contrast, in 2022 there was a significant increase in water consumption for once-through cooling at Mělník and Opatovice power stations when, due to the energy crisis on the European market caused by the war in Ukraine and the subsequent lack of natural gas, the condensation production of electricity obtained from coal increased significantly. These examples show that sudden and unforeseen events can have a significant impact on water consumption for energy industry. Fig. 9 shows an overview of the current use of water in energy industry for 1980–2022 in comparison with other sectors.
- Prediction of future demand: The basic scenario that sets long-term goals and direction in the field of energy industry at the country level is the State Energy Concept (SEC). It is a key strategic document whose main purpose is to ensure the stability, security, and sustainability of the energy industry sector in the long term, which has a major impact on the economy, the environment, and social aspects. SEC formulates priorities in the area of energy production and consumption and sets the development in the area of energy sources; on the basis of stricter environmental regulations, preferred or, conversely, non-preferred energy sources will be determined. By the editorial deadline of this article, the new SEC had not yet been approved (its approval was postponed by the government on 17th July 2024). The authors of this article therefore base their predictions on the published MPO document “Aktualizace Státní energetické koncepce” (Update of the State Energy Concept) dated 8th February 2024 [23]. According to this document, the not-yet-approved SEC envisages a reduction in the use of coal – especially in connection with the production of electricity and heat – with the fact that, after 2033, coal consumption will be limited to non-energy use only (see Tabs. 6 and 7). On the basis of this available information, the water demand was predicted according to future operated energy industry sources.
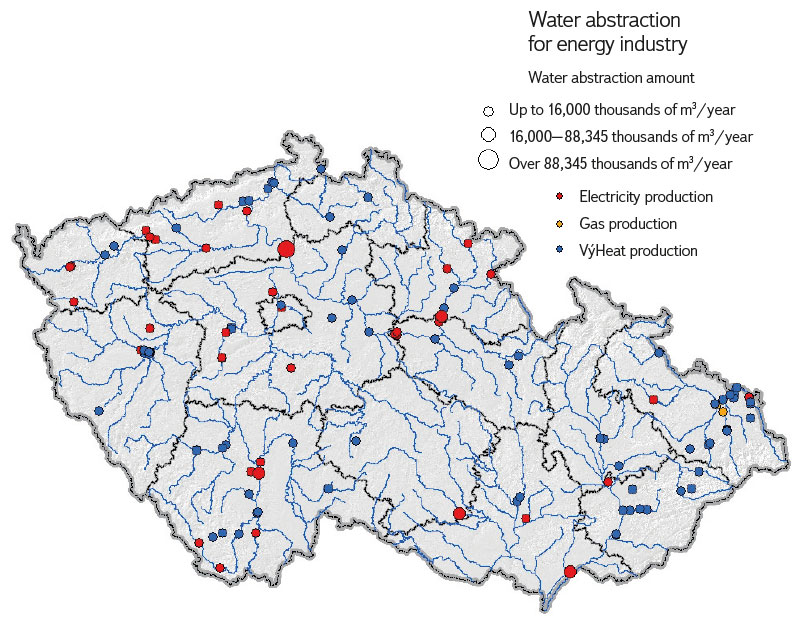
Fig. 8. Surface and groundwater abstraction locations for energy in 2013–2022 – differentiation by quantity and type of production
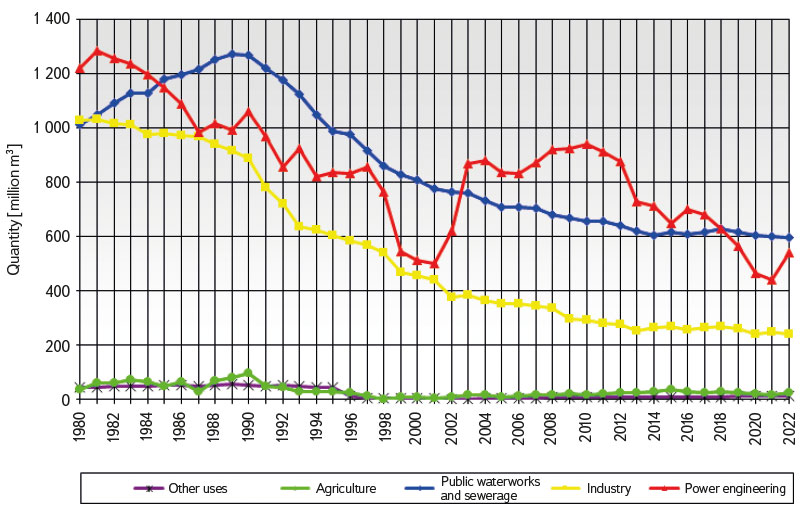
Fig. 9. Groundwater and surface water abstractions in the Czech Republic 1980–2022
Tab. 6. Corridors for primary energy sources (relative to their total annual consumption)
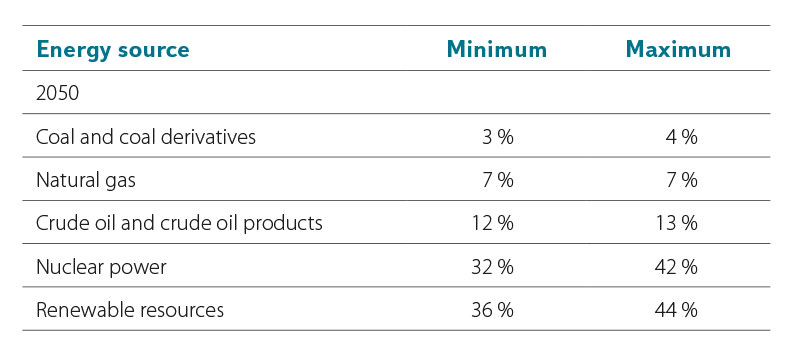
Tab. 7. Corridors for gross electricity generation (relative to total annual generation)
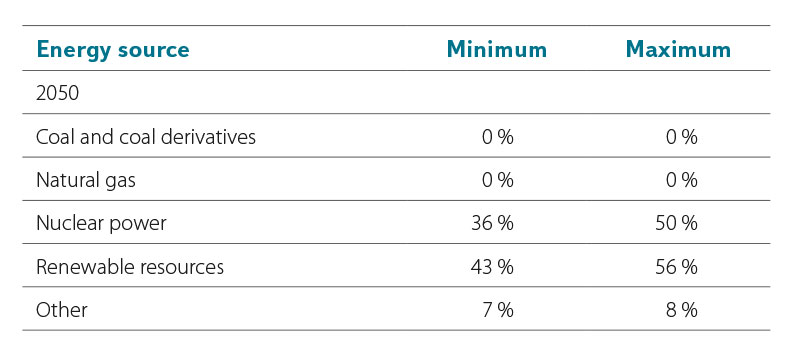
Overall, it can be assumed that more than a third of coal-fired power stations will be shut down, and those that remain will switch to burning biomass. There will also be an increase in water consumption for the Temelín and Dukovany nuclear power stations. In the case of most heating plants, it is expected that after the necessary modernization, they will remain in operation and burn biomass.
The prediction itself was determined by calculating the average maximum and minimum quantity abstracted in 2013–2022 for individual consumers. For each abstraction point, an index of future demand was determined, which was then used to calculate the average maximum and minimum amount per demand in 2050. For the maximum and minimum estimated demand, the drop in surface and groundwater abstraction amounts to about 18 %. Fig. 10 shows a comparison between the maximum and minimum average energy consumption for 2013–2022 and the prediction for 2050. Fig. 11 shows this comparison broken down by regions.
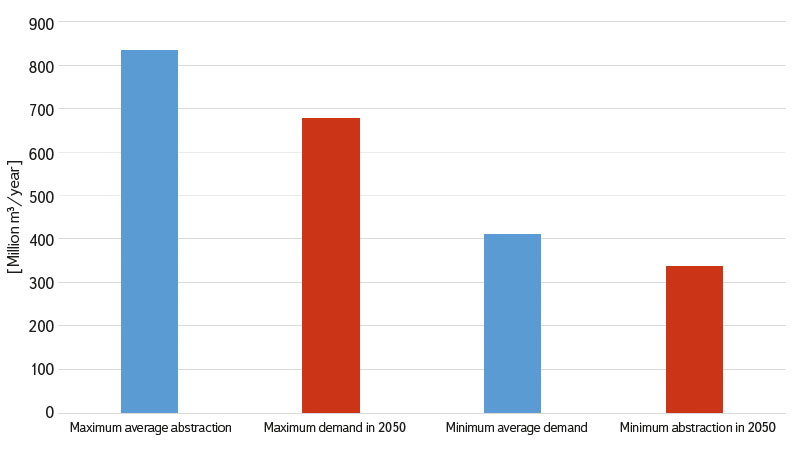
Fig. 10. Maximum and minimum average surface water and groundwater abstractions for energy for 2013–2022 vs. estimated minimum and maximum abstractions for energy in 2050
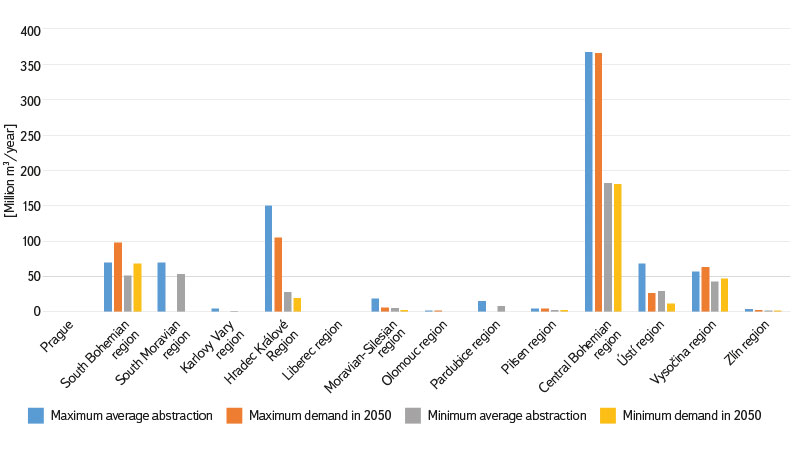
Fig. 11. Maximum and minimum average surface water and groundwater abstraction for the power sector for the years 2013–2022 vs. estimated minimum and maximum abstraction for the power sector in 2050 by region
CONCLUSIONS AND UNCERTAINTIES
The estimate of water consumption for the energy industry indicates a reduction in water demand for this sector compared to the current situation; the reduction in water demand by 2050 will be about 18 %. Despite the large degree of uncertainty, which is caused by the year of prediction, these values are actually realistic. It is also assumed that, due to the complexity of large constructions, there will be no significant transfer of energy production between regions. Similar to other sectors, in the case of predicting water demand for the energy industry, there are uncertainties, which are reflected in the factors affecting water demand now and in the future. With a view to 2050, an increase in the demand for electricity generation is expected, which will be a direct consequence of a higher use of electricity than now (electromobility, heat pumps, air conditioning, etc.). On the other hand, an increase in electricity production from renewable sources (solar power, wind power, etc.) is expected, which do not affect water demand. Among the general factors that influence the water demand are, in particular, the technology used, installed capacity of the power station or heating plant, efficiency of cooling, and use of recycling technologies. In terms of natural resources, these are primarily precipitation and air temperature; a decrease in precipitation and an increase in temperature can affect both the availability of water for cooling and the demands on the necessary amount of water abstracted. A longer period of drought could then result in lowering water resource levels and thus an increase in water temperature, which would again increase demand on water for cooling. In terms of legislation, these are laws and regulations related to water use that affect the operation of power engineering facilities, while environmental regulations may require more efficient use of water. From an economic point of view, these are also the price of water and the costs of its treatment that will influence decisions on the types of energy sources and technologies. In view of ongoing changes, it is important to continuously monitor the development of this issue and regularly update predictions.
Analysis of water demand for human consumption
TGM WRI researchers found that water abstraction for public water supply systems (based on data recorded for the need to prepare the water balance according to Decree 431/2021 Coll.) currently accounts for around 40 % of total water abstraction, with about 30 % of total surface water abstraction and about 80 % of total groundwater abstraction. In the case of surface water, approximately 90 % of the amount abstracted is provided by reservoirs. The difference between surface and groundwater abstraction is in the number of abstraction points (and related mean capacity): while surface water for public water supply systems is abstracted from around 140 abstraction points (of which approximately 50 are from reservoirs), groundwater is provided by from approximately 2,500 abstraction points. Analysis of future water demand for public water supply systems is therefore important for both surface and groundwater balance; however, it is absolutely crucial for groundwater. While individual abstraction points (especially abstractions from reservoirs) can be assessed individually, groundwater abstraction must be aggregated into larger units for balance purposes. The solution can be provided by “working units of groundwater bodies” used in the Czech Republic in planning according to the Water Framework Directive (full name: Directive 2000/60/EC of the European Parliament and of the Council of 23 October 2000, establishing a framework for Community action in the field of water policy). These are about 1,200 territorial units covering the entire area of the Czech Republic in three horizontal positions.
METHODOLOGY
The forecast for water demand for public water supply systems is based on demographic development forecast for 2050, which was provided by the Faculty of Science Charles at University in Prague as a subcontract for the project. The forecast contains data on the development of the number of inhabitants in municipalities with extended powers in three variants (high, low, medium) and in the division into urban and rural areas. The rural population, according to the Czech Statistical Office (CZSO) definition, includes residents of all municipalities with a size of up to 2,000 inhabitants and also municipalities with a size of up to 3,000 inhabitants which have a population density of less than 150 inhabitants/km2. In the next steps, the way the forecasted changes in the number of inhabitants can be reflected in the requirements for water abstraction was evaluated. For this purpose, data of the Majetková evidence vodovodů (Property records of water supply systems) recorded in accordance with Decree 428/2001 Coll., and data on the actual amount of water abstraction recorded for the need to prepare the water balance according to Decree 431/2021 Coll. were used. The researchers first calculated the forecasted changes in the number of inhabitants by 2050 provided for individual municipalities with extended powers based on the current number of inhabitants per individual municipality (using CZSO data on the current number of inhabitants in municipalities). In the next step, they projected the forecast of changes in the number of inhabitants into changes in water demand. The procedure was as follows: surface and groundwater abstraction for public water supply systems were identified in the register of places and the actual amount of water abstracted for the need to prepare the water balance. With the help of data from the Property records of water supply systems, abstraction points were connected to the supplied municipalities (the property records of water treatment plants state the abstraction point identifier according to the records for the water balance as well as the list of supplied cadastral areas). According to the ratio of predicted changes in the number of inhabitants in the supplied municipalities (compared to the present), future demand for the amount of water abstracted at individual abstraction points was also suitably adjusted (at the same ratio) compared to current demand. The average amount abstracted between 2016 and 2021 was considered as current demand. In the case of groundwater, abstraction data and their predicted changes by 2050 (for the purposes of the balance assessment of resources and demand) were further aggregated to the level of the so-called working units of groundwater bodies used (also as balance units) for planning purposes. This procedure was partially (to a lesser extent also details and on older data of the Record for the water balance and the Property records of water supply systems and sewerage) applied and verified in project No. VI20192022159 “Vodohospodářské a vodárenské soustavy a preventivní opatření ke snížení rizik při zásobování pitnou vodou” (Water management and water supply systems and preventive measures to reduce risks in drinking water supply).
RESULTS
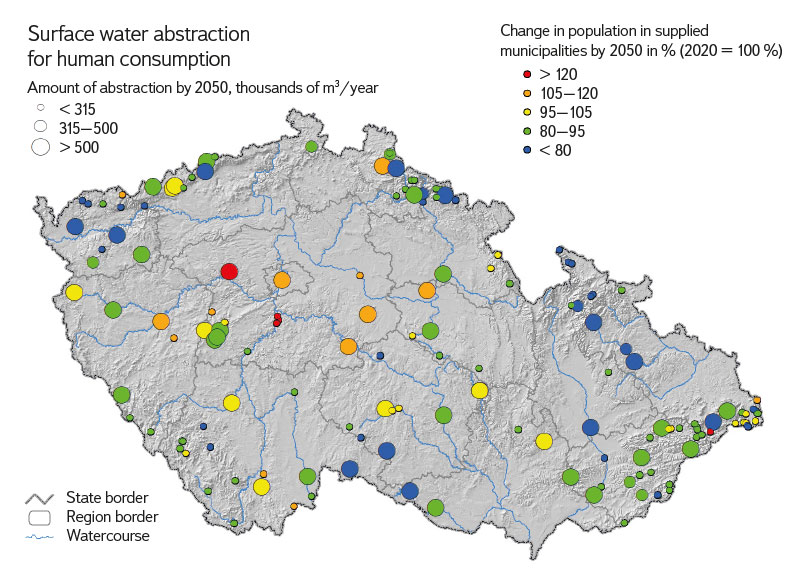
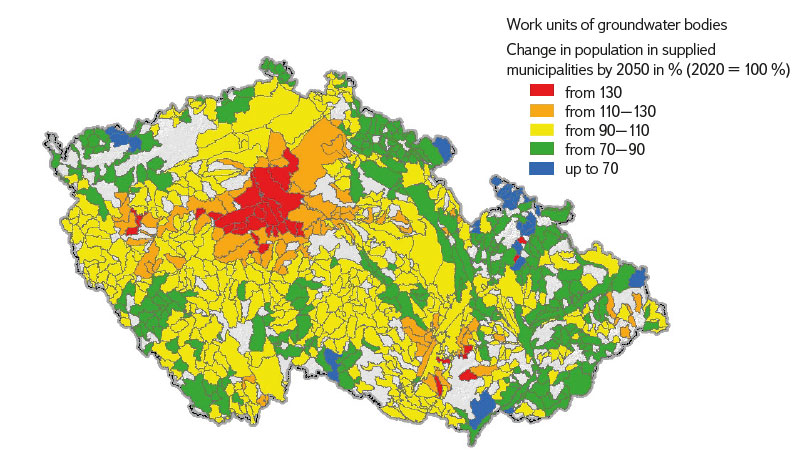
Changes in the number of inhabitants in the supplied municipalities in the reference year 2050 compared to the present for current surface water abstraction points are shown in Fig. 12, and for the working units of groundwater bodies in Fig. 13.
Fig. 12. Surface water abstractions for public water supply and change in the number of inhabitants supplied by 2050 – medium variant
Fig. 13. Groundwater body work units and population change in municipalities supplied by public water supply by 2050 – medium variant
For significant (over 500,000 m3. year-1) current surface water abstraction for public water supply systems, an increased number of connected inhabitants by more than 10 % was predicted for the following water reservoirs: Švihov (by 23 % for the high variant, by 14 % for the medium variant), Klíčava (by 18 % for the high variant, by 11 % for the medium variant), Josefův Důl (by 114 % for the high variant) and Vrchlice (by 112 % for the high variant). In the case of groundwater abstraction, an increase in the number of connected inhabitants was predicted in particular in (parts of) hydrogeological districts 6250 Proterozoic and Palaeozoic in the Vltava tributary basin, 6320 Crystalline in the Middle Vltava basin, 6230 Crystalline, Proterozoic and Palaeozoic in the Berounka basin, 6240 Upper Silurian and Devonian Barrandien, and 4510 Cretaceous north of Prague.
UNCERTAINTIES
The work was based on data available nationwide, i.e. only on the forecast of the number of residents, and therefore did not take into account, for example, abstraction from public water supplies for services or industrial enterprises. The uncertainty in the prediction of the number of supplied residents was reflected by considering high, medium, and low variants of the demographic forecast. Some simplification was also achieved by considering the number of supplied residents on a municipal scale (the actual connection to a certain water abstraction may only concern parts of municipalities).
CONCLUSION
Ensuring sustainable management of water resources will be a key challenge in the coming decades, especially as climate change and other factors may significantly affect water availability and demand. It is therefore important to determine the future demand for water in important economy sectors.
Industry: The future water demand in industry was not addressed by predicting future developments, but by setting three fixed levels against which it will be possible to compare the actually available water resources at a given time. The starting point for their determination was an analysis of abstractions at the regional level. The baseline assumes that industrial water demand in the future will be similar to the current one, or at the end of the assessment period 2009–2019. Maximum value of future abstractions: the largest volume of water abstracted recorded in 2009–2019 is used; it provides a realistic estimate of possible positive deviations from the baseline. Critical value (must not be exceeded): in the analysed period 2009–2019, the limits (maximum permitted quantities) for groundwater and surface water abstractions were not fully utilized, thus providing a reserve that is at least theoretically available to the relevant businesses. We can assume that the limits for specific entities will not be increased in the future, thus determining a critical limit for the use of water resources.
Agriculture: Analysis of irrigation technology in the Czech Republic and estimation of irrigation water losses enabled calculation of the approximate maximum amount of water needed for irrigation of typical crops such as “vineyards”, “hop fields”, and “orchards”. Calculation of the indicative amount of water needed for irrigation of crops such as “arable land” and “permanent grassland” was carried out, while it is clear that irrigation on arable land is concentrated to a decisive extent on vegetables and early potatoes, and on permanent grassland on meadows for the production of fodder for dairy cattle. Development towards full irrigation is not realistic – the assumption of using irrigation was applied only where irrigation is already established. It is quite clear that groundwater should not be used massively for irrigation in critical areas, as it is valuable water that should be reserved for drinking purposes. Moreover, there will obviously be a combination of the demand for irrigation and low flow rates in watercourses (longer periods of drought and heat). Water demand will therefore only be met by the construction of additional reservoirs, or by adjusting the handling schedules of existing reservoirs, if they have free capacity. The results of Global Circulation Models (GCM) for various emission scenarios, especially for the periods 2015–2045 (2030) and 2035–2065 (2050), show that irrigation is needed even in regions where the average water demand is decreasing. However, what remains an unanswered question is the impact of the yet unconsidered variant based on the estimate of the GLOBIOM-CZ agro-economic model. It indicates a significant comparative advantage of Czech agricultural production in the expected environmental conditions, and therefore the possibility – despite climate change – of increasing the profitability and market share of Czech agriculture on the market. The development of water consumption by livestock has been predicted for each region separately; trends across the regions vary. A steady state of water consumption by livestock is predicted for the South Moravian, Ústí nad Labem, Zlín, and Vysočina regions; a slight increase is expected in the South Bohemian and Pilsen regions; a significant increase in water consumption is predicted for the Karlovy Vary, Liberec, and Moravian-Silesian regions; a future decrease in water consumption by livestock is expected in the Hradec Králové, Olomouc, and Pardubice regions as well as in Prague and the Central Bohemian region. Trends in water consumption in individual regions are identical for both mean and maximum water consumption by livestock.
Energy industry: The water consumption estimate for energy industry indicates a reduction in water demand for this sector compared to the current situation. It is also assumed that, due to the complexity of large-scale construction, there will be no significant change in energy production between regions. One of the main factors influencing water demand for energy industry will be environmental regulations. From an economic perspective, this may also be the price of water and the costs of its treatment, which may influence decisions on the types of energy sources and technologies.
Public water supply: For significant (over 500 thousand m3. year-1) current surface water abstraction for public water supply systems, an increased number of connected residents by more than 10 % was predicted for the following reservoirs: Švihov (by 23 % for the high variant, by 14 % for the medium variant), Klíčava (by 18 % for the high variant, by 11 % for the medium variant), Josefův Důl (by 114 % for the high variant), and Vrchlice (by 112 % for the high variant). In the case of groundwater abstraction, an increased number of connected residents was predicted especially in (part of) the hydrogeological districts Proterozoic and Palaeozoic in the Vltava tributary basin, Crystalline in the Middle Vltava basin, Crystalline, Proterozoic and Palaeozoic in the Berounka basin, Upper Silurian and Devonian Barrandien, and Cretaceous north of Prague.
Estimates of water demand for various sectors of the economy are burdened by many uncertainties and variable factors. The main areas of uncertainty and variables that can affect the estimate of water demand include technological progress (innovation and new technologies), climatic factors, economic factors, demographics, and legislative measures. For more accurate estimates, it is therefore necessary to constantly update data and models based on new trends and technologies. Regular monitoring and adaptive management of water resources are key to efficient and sustainable water use.
This article briefly presents the results of the sub-objective “Scenarios of future water demands for various climate scenarios and individual sectors of water use” which is part of TA CR project No. SS02030027 “Water systems and water management in the Czech Republic and climate change conditions (Water Centre) “. More detailed information can be found on the “Water Centre” website (https://www.centrum-voda.cz), including visualization of database data in the Tableau environment.
Acknowledgements
The article was prepared as part of project No. SS02030027 “Water systems and water management in the Czech Republic and climate change conditions” implemented with financial support from the Technology Agency of the Czech Republic within subprogramme 3 – Long-term environmental and climate perspectives of the SS programme – Programme of applied research, experimental development and innovation in the field environment – Environment for life. The authors would also like to thank Ing. Miroslav Bauer from CTU for preparing Fig. 2.
The Czech version of this article was peer-reviewed, the English version was translated from the Czech original by Environmental Translation Ltd.
