ABSTRACT
Groundwater drought affecting groundwater availability is still mostly understood as a subset of hydrological drought. The impact of hydrological drought on groundwater is manifested with a delay and depends on its duration. An expert interactive Map of the Vulnerability of the Quantity of Dynamic Groundwater Resources to Drought for the Czech Republic was created as part of the TA CR project SS01010208 – “Controlled Groundwater Recharge as a Tool to Reduce the Impacts of Drought in the Czech Republic”. The presented vulnerability map is created on the basis of the use of precipitation normal and regression relationships between precipitation and total runoff and groundwater discharge (base flow) using the Base Flow Index (BFI) and ratio of base flow in the driest year of 2010–2019 to the long-term average of base flow (M index), which guarantees uniform processing for the entire Czech Republic at a scale of 1 : 50,000 and an objective comparison of the vulnerability of dynamic groundwater resources to drought throughout the country. It is also based on recorded groundwater abstraction and in the case of municipalities with individual supply, the abstraction is calculated from the number of inhabitants and the national average consumption of drinking water per capita. The Map is compiled based on the balance of dynamic groundwater resources and groundwater abstraction. It contains six categories and shows which regions and areas will struggle to have sufficient groundwater resources during periods of prolonged drought. It synthesizes all available flow logs and other data until 2020 and is designed so that the layers with variable information can be updated in the future.
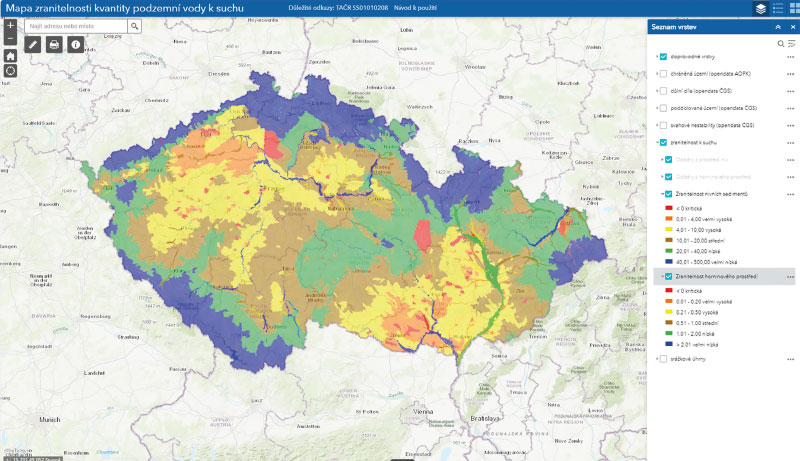
This map is available at www.suchovkrajine.cz/zranitelnost-k-suchu and enables the preparation, design and implementation of measures that will ensure sufficient water resources, especially of drinking water, for the population even in periods of long-term drought.
INTRODUCTION
We are in a period of climate change, which is characterized by more frequent extreme weather fluctuations. In 2015–2020, there was an unusually long period of hydrological drought in the Czech Republic which, in a large part of the country, caused a drop in groundwater levels and a lack of water sources, especially in smaller settlements. Drought affects the state of groundwater with great persistence. Almost three-quarters of the Czech Republic is made up of rocks that have a low ability to accumulate larger reserves of groundwater for several years, and thus most of the water drains from the country. Groundwater resources in these areas are dependent on regular annual recharge from rainfall which, however, is highly variable in quantity. Among the main priorities of the country is the provision of sufficient groundwater resources to supply the Czech population, even during periods of prolonged drought.
One of the goals of the project ISTA TA CR SS01010208 “Controlled Groundwater Recharge as a Tool to Reduce the Impacts of Drought in the Czech Republic” was therefore the methodology and creation of a Map of the Vulnerability of the Quantity of Dynamic Groundwater Resources to Drought for the operational management system of the Ministry of the Environment.
Groundwater resources consist of the volume and flow of groundwater in the aquifer in accordance with Decree No. 369/2004 Coll., on the design, implementation and evaluation of geological activities, as amended.
Groundwater resources include:
- The amount of water flowing in a given time (month, year) through an aquifer, i.e. the dynamic resources of groundwater expressed in volume units per unit of time – usually l/s. The volume of these dynamic resources fluctuates depending on the recharge, mainly by groundwater recharge fed by precipitation, locally also by seepage from streams. Dynamic groundwater resources are usually considered equal to base flow in the longer-term average.
- The volume of water that fills the pores, cavities, and fractures in the aquifer (static groundwater reserves), i.e. the volume of water in the water-bearing part of the aquifer, expressed in volume units (m3). However, static reserves are only the volume of water filling the rock environment. The only rejuvenating element are dynamic resources. The rate of decline of base flow in the dry season (of dynamic groundwater sources) also reflects part of the static storage to some extent, since the volume of the static reserves and the rate of water release from them determine the base flow in the period when potential evapotranspiration prevails over precipitation. The relationship between groundwater resources, recharge, and drainage is expressed in Fig. 1.
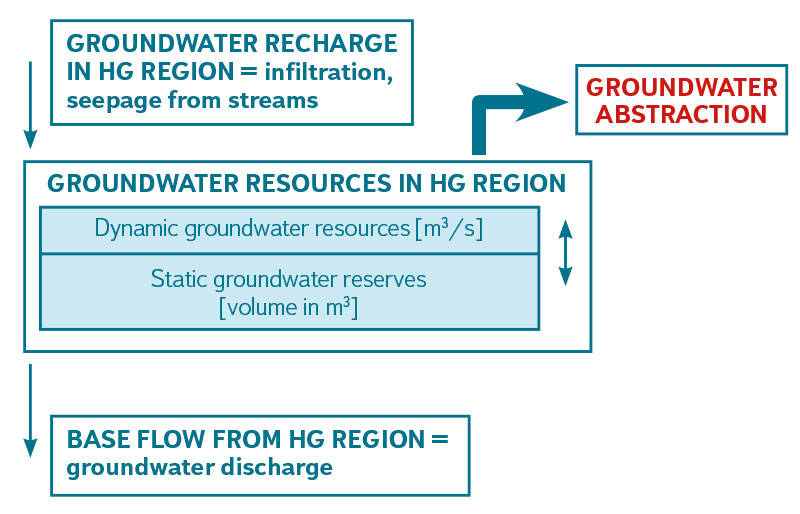
Fig. 1. Groundwater resources
METHODOLOGY
Compilation of the Map of the Vulnerability of the Quantity of Dynamic Groundwater Resources to Drought (hereinafter referred to as Map of Groundwater Drought Vulnerability) is not sufficient with information on the size volume of groundwater resources; the Map must also contain information on the intensity of groundwater abstraction. In the Czech Republic, the hydrogeological regions (HGR) with the greatest groundwater resources are often largely used to supply the population with drinking water, so it is not true that the greater the groundwater resources, the lower the vulnerability of dynamic groundwater resources to drought. The opposite statement does not apply either. It always depends on the difference between the groundwater resources and the rate of their use, and different variability of groundwater resources recharge over time is also reflected, as well as the amount of groundwater in static reserves, which is reflected in the rate of decline of base flow in the dry season.
The HEIS information system (https://heis.vuv.cz/data/webmap/), managed by TGM WRI, contains abstraction points (4,693 sites with groundwater abstraction and 941 with surface water abstraction) and water discharge (5,092 sites with surface water discharge and 28 with discharge into groundwater) that are subject to registration in the sense of Decree No. 252/2013 Coll. (data as of 2020).
Furthermore, there are over 1,000 municipalities dependent on the individual supply of drinking water to the population, where groundwater abstraction is not subject to records; at the same time, it is these municipalities that often have problems with ensuring sufficient groundwater supply in dry periods. In order to use all this information effectively, it was necessary to compare the groundwater resources and their variability over time with groundwater abstraction from the same area. In the area outside the main aquifers and Quaternary aquifers, which is not expedient to divide into smaller units, the fourth order stream basins (of which there are 8,750 in the Czech Republic) were used as a basic unit.
The Map is a scale of 1 : 50,000. It is based on logs ofstream discharge and precipitation of the Czech Hydrometeorological Institute (CHMI), available at https://www.chmi.cz/historicka-data; data on recorded groundwater and surface water abstraction and discharge from the HEIS database; and information about municipalities and their parts that do not have a water supply connection according to the available Water Supply and Sewerage Development Plans (PRVKUK) for each region from the Ministry of Agriculture website (https://mze.gov.cz/public/portal/mze/water/waterworks-and-sewerage/plans-development-of-water-
-works-and-sewerage, from 2007); records of residents in municipalities, etc.
Basic environment types
For the purposes of the Map of Groundwater Drought Vulnerability, the Czech Republic was divided into four basic environments which have very different characteristics in terms of groundwater resources and recharge:
- hydrogeological basins and Quaternary aquifers, i.e. aquifers with extensive groundwater flow systems usually not respecting orographic drainage divides,
- hardrock environment, i.e. the environment of hard rocks and heavily cemented sediments, where the aquifer is mainly in the zone of near-surface fracturing and weathering of rocks, the groundwater flow corresponds to the surface topography (downslope flow),
- floodplains of rivers and smaller streams, where there is possibility for induced recharge, i.e. groundwater sources derived from the surface streams, from extensive orographic basins higher upstream, or hinterland,
- populated parts of municipalities with predominant individual groundwater supply, where there is relatively high abstraction of groundwater per unit of area for the needs of the inhabitants.
- A) Hydrogeological basins and Quaternary aquifers (except valley floodplains) were taken into consideration. The basal Cretaceous aquifer
A (Cenomanian sediments) was not evaluated as it is less sensitive to drought compared to the above lying aquifers in the base layer and, with exceptions, its use is low. Hydrogeology basin structures usually form an integrated flow systems, and therefore HGR were treated as elementary units, i.e. the calculation of the balance of groundwater resources was carried out for a whole unit; the whole zone has a uniform vulnerability. Environment A includes permeable parts of the Bohemian Cretaceous Basin, the South Bohemian Basin, and Quaternary regions. - B) The environment of near-surface hardrock aquifers and their equivalent includes all other areas. This includes areas of igneous, metamorphic, and folded sedimentary rocks and parts of the Bohemian Cretaceous basin where aquitards (permeable only in the near-surface zone) of the Tertiary Carboniferous to Permian rocks prevail, i.e. the vast majority of the Czech Republic. These are areas that have limited static groundwater reserves and are therefore dependent on an yearly recharge from rainfall. In contrast to environment A, there are usually no larger aquifers here, where the cone of depression would spread laterally to a distance of hundreds of metres or more. In these areas, the territory was divided into individual fourth order basins, e.g. to small units.
- C) River floodplains differ from other environments in the fact that groundwater resources per unit area are generally orders of magnitude higher here than in the surrounding rocks. The environment is in hydraulic contact with a surface stream; at the same time, groundwater from surrounding rocks or sediments drains here via fluvial sediments into the stream, so it is usually possible to obtain an order of magnitude higher amount of groundwater in the floodplains than in the surrounding environment. For the above reason, a large number of water-collecting facilities are located in the area of river or stream floodplains.
- Floodplain areas were extracted from geological maps “GeoČR50” from the Quaternary layer, namely polygons with the attribute in the genesis column fluvial undivided + reservoir sediments. The continuous floodplain area obtained in this way was divided into sections in which it is possible to calculate the hydrogeological balance. In each of the second order basins, there is a main stream that has tributaries from the right and left sides. The area of the floodplains of the right- and left-hand tributaries was manually separated from the floodplain of the main stream. The floodplains of the left- and right-hand tributaries were defined only if their length exceeded 9.5 km (the basins of shorter segments were very similar by size to the fourth order basins). Shorter tributaries were cut out with a buffer of 250 m. This was followed by unification of the individual floodplain areas according to the second order basins – the main stream within the second order basin and its right- and left-hand tributaries were separated (the main stream floodplains and the floodplains of each individual tributary form segments). Larger rivers flowing through several second order basins (e.g. the Sázava, the Vltava) have a continuous floodplain from the spring to the confluence with the larger stream. Smaller stream that do not exceed the second order basin are also formed by a single floodplain segment. After that, the area of all floodplain segments was determined, and for each floodplain segment, the total area of its orographic basin was determined. Two data are thus available for each defined floodplain segment: the area of the floodplain segment and the area of its orographic basin.
- D) Municipalities with individual groundwater supply.
The build-up parts of municipalities with predominant individual supply were defined as follows. Based on the available PRVKUK plans and the digitized layer of the water supply pipelines, municipalities that do not have a water supply system were selected. According to the overlay of municipalities, those that did not cross the water supply pipelines were chosen. After that, the check of the obtained selection of municipalities was carried out according to PRVKUK tables and plans. As a result, a layer was created containing over 1,726 parts of municipalities without public supply of drinking water (out of a total of 1,035 municipalities). For these municipalities, the area of the built-up part was determined. Its basis is a map of building blocks (map of the Czech Republic 1 : 50,000) obtained using an orthophoto map with manual completion of built-up areas in selected municipalities using polygons in GIS. This was followed by a check and verification of the correctness of the range of polygons and their affiliation to individual municipalities. After that, the area of the built-up parts of the polygons was determined for each municipality. If the municipality consisted of several parts, all parts of the municipality were dealt with together. It is worth noting that the PRVKUK plans for individual regions (publicly available on the websites of the relevant regions, or the Ministry of Agriculture) at the time of processing the groundwater vulnerability layer to drought mainly date from 2007 and provide information on the existence of water mains with the outlook for 2015.
Computational planar elements in environments A to D:
- for environment A (Hydrogeological basin and Quaternary HG region), the element is the entire HGR, with the exception of floodplains,
- for environment B with a near-surface aquifer, the element is the fourth order basin, with the exception of floodplains,
- for environment C, i.e. the floodplains of smaller stream, the element is the entire floodplain,
- for environment D, i.e. municipalities, the element is a built-up area of a part of the municipality.
Individuální GIS layers and determination of base flow
The basis for the Map of Groundwater Drought Vulnerability consists of the following GIS layers:
- dynamic groundwater resources corresponding to the base flow in the dry season (l/s/km2),
- recorded groundwater and surface water abstraction (l/s).
For all types of planar elements except floodplains (i.e. A, B, D), the groundwater source is considered to be base flow. Only for floodplains that have the potential recharge from stream seepage, the groundwater source per floodplain area unit is higher (see below).
Layer of groundwater recharge from precipitation
Long-term base flow – dynamic resources of groundwater by hydrograph separation
Groundwater recharge corresponds to the precipitation total, minus evapotranspiration and water temporarily stored in the soil and unsaturated zone. Since neither the actual evapotranspiration nor the stored amount of water in the unsaturated zone can be effectively determined on larger areas, the average value of groundwater recharge is determined from base flow. All water that has become groundwater (recharge) must sooner or later leave the ground in the form of base flow. Thus, base flow is being considered which corresponds to groundwater recharge for a certain period of time. However, the equation between groundwater recharge and base flow is valid only for long-term averages (several years or more), when the change in storage becomes negligible compared to recharge and discharge. number of different methods are used in the Czech Republic to determine base flow.
One of the main ones, which still remains a benchmark for comparison with the results of other methods, is Kille’s method [1]. It is based on the lowest values of average daily discharge of streams in individual months from at least a ten-year time series. The advantage is easy determination, the disadvantage is getting a single average value of the base flow over a long period. This restriction is particularly inconvenient at present, when the base flow can change quite significantly due to climate change. Based on Kille method, the first map of groundwater recharge, or base flow from the Czech Republic was created [2].
In the past, the Kliner-Kněžek method was also used [3]. It derives base flow from measured pairs of the groundwater level in the borehole and the stream discharge plotted together. Its advantage is the consideration of fluctuations in the groundwater level, i.e. an indicator of the actual oscillation of groundwater resources. On the other hand, the disadvantage is significant sensitivity of the results to the selected pair of the borehole and stream profile. In many areas, a suitable borehole with logs of groundwater level measurements corresponding to the evaluated aquifer is not available.
At present, two approaches are most commonly used to determine base flow, both based on hydrograph separation. The first is separation using Eckhardt filter [4]. This approach is widely used abroad and is also used by the CHMI to determine dynamic groundwater resources in HGR and to determine base flow in basins and areas where hydrological balance has been calculated. The method is derived from the Boussinesq equation. Eckhardt’s digital filter applied to total daily discharge has two parameters: recession coefficient of discharge decline over time, and Base Flow Index (the ratio of the average base flow to the average total runoff ). The derivation of parameters is time-consuming and methodologically demanding.
The second approach is the separation of base flow by the moving minima method [5]. A moving 31-day minimum is applied to the daily step total discharge data, and the resulting series is then smoothed with a 31-day moving average. The only parameter in this case is the size of the moving window (31 days). This procedure is inspired by the method used in Great Britain (UKIH, see e.g. [6]). Its advantage is simplicity, and therefore it is less time-consuming.
Base flow obtained by the Eckhardt filter method represents on average 70–80 % of base flow obtained by the moving minima method.
For the purposes of the Map of Groundwater Drought Vulnerability, base flow was uniformly separated using the moving minima method from the available daily discharge data of 518 CHMI gauging stations in 1981–2019. Unlike the previously widely used Kille method [2], this method of separation allows determination of the variable value of base flow with a monthly resolution. This is especially valuable today, when base flow can change in time quite significantly due to climate change.
Base Flow Index
At each CHMI gauging station, Base Flow Index (BFI) was obtained as the ratio of the average base flow from the moving minima method to the average total runoff. BFI therefore shows what proportion of the total runoff constitutes base flow in long-term average.
Tab. 1 shows BFI for all HGR in the Czech Republic derived from the separation of the hydrograph on the CHMI gauging profiles. It is evident that the HGR in the flysch and Carpathian foreland have by far the lowest BFI (index 0.3, i.e. only 30 % of the total runoff is base flow on a long-term average, the rest is quick flow, i.e. surface and subsurface runoff ). The vast majority of HGR in the Czech Republic have BFI values between 0.4 and 0.5, so base flow here makes up 40–50 % of total runoff. These are primarily rocks of crystalline rocks, culm, parts of the Carboniferous to Permian sediments, and those parts of the Cretaceous HG regions where aquitards predominate on the surface. This is followed by transitional areas with a BFI between 0.55–0.65 with Cretaceous, Carboniferous to Permian and, exceptionally, crystalline rocks. Several Cretaceous HG regions have a BFI of 0.7–0.75, documenting considerable storage capacity.
The highest BFI is represented by a belt of HGR along the Jizera and the Labe right-hand tributaries (basins of the Zábrdka, Bělá, Skalský stream, Košátecký stream, Pšovka, Liběchovka, Obrtka), formed by highly permeable Cretaceous calcareous sandstones and sandy limestones, in places with karst permeability [7]; they have an extreme storage capacity probably due to the alternation of porous and calcareous sandstones, where BFI reaches anomalously high values of 0.75–0.9. Here, base flow accounts for 75–90 % of total runoff, and quick flow is therefore insignificant.
Tab. 1. Base Flow Index (BFI) values derived from the separation of hydrographs on watercourses in different zones (HGR)
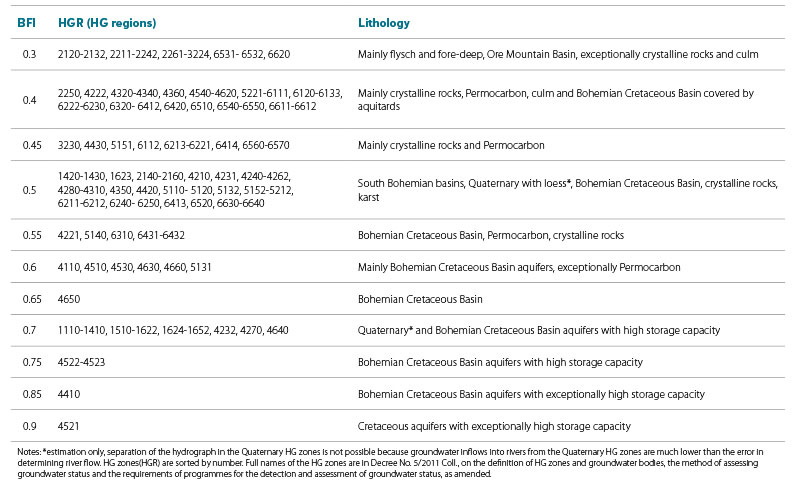
For Quaternary fluvial aquifers, BFI was only tentatively estimated to be 0.7 for most Quaternary fluvial HG regions and 0.5 for loess-covered fluvial aquifers. This estimate is based on the fact that surface runoff does not occur from Quaternary fluvial aquifers. However, the course of the groundwater levels in the boreholes documenting the Quaternary fluvial aquifer indicate the presence of a quick flow as well. The actual BFI can be higher up to a value of about 0.9 there. However, with the value of 0.7 used, the data from the Map of Groundwater Vulnerability to Drought remains on the safe side of uncertainty, and a lower value is thus desirable. HGR with the lowest BFI are, as follows from the above, formed by rocks with very low permeability.
In contrast, HGR with the highest BFI represent rocks with high permeability and considerable storage capacity in the event of a deficit in groundwater recharge.
Independent treatment of BFI is presented in [8], where the average BFI values of for several groups of rocks and also BFI for gauging stations on the river network are given.
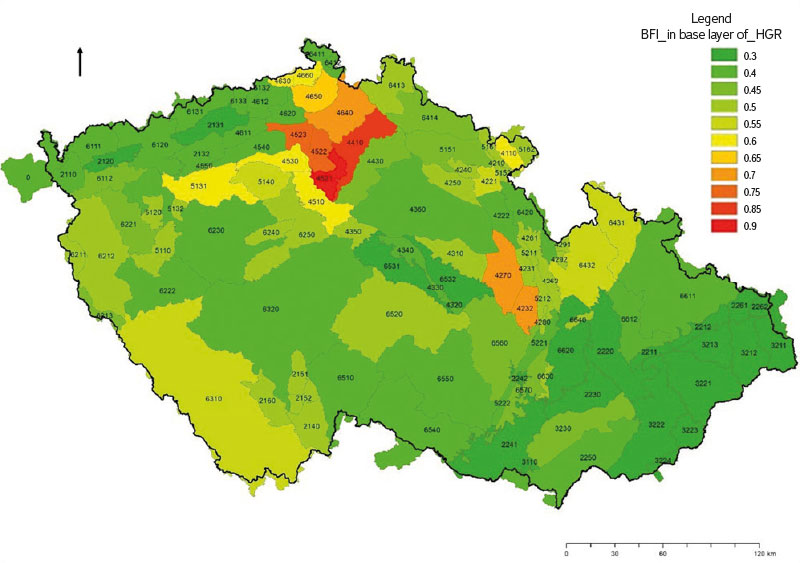
Fig. 2. Base Flow Index obtained by separating hydrographs from 518 streams in the Czech Republic monitored by the CHMI and assigned to individual HGR in the base layer (Tab. 1)
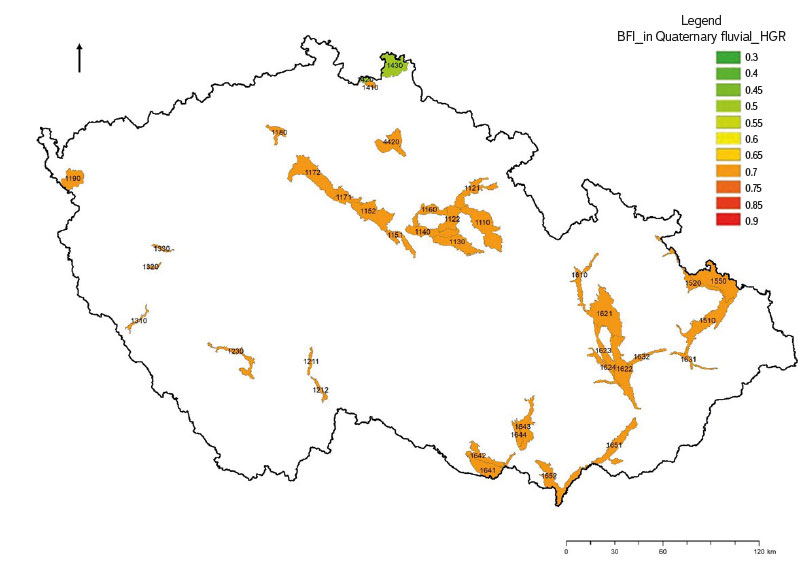
Fig. 3. Base Flow Index assigned to individual HGR in the upper layer (Tab. 1)
Base flow – dynamic sources of groundwater in the dry season
Dynamic groundwater resources for the dry season were determined as average annual base flow on the CHMI profile in the driest recorded year for 2010–2019 in given basin. Base flow obtained in this way may appear to be overestimated, as the flow rates of a number of surface streams sometimes decrease significantly in summer.
However, defining dynamic resources on the basis of minimum discharge from the summer season does not appear to be appropriate, as studies from recent years show that under hot summer temperatures a complete loss of stream flow can occur – not because of an extreme decrease in base flow, but because of extreme evapotranspiration of water from floodplain by vegetation and from water bodies [9].
At the same time, the loss of stream flow is manifested only in the summer and possibly lasting till autumn due to the drop of the water level below the riverbed. If this discharge strongly affected by evapotranspiration is taken as a value typical for drought, then there would be literally no groundwater reserves at a number of streams in lower altitudes (discharge e.g. only 0.07 l/s/km2) and even the smallest groundwater abstraction from these large basins would lead to the distortion that the basins are extremely vulnerable and are over-exploited. However, it is obvious from spring discharge in these basins that even though surface stream discharge drops drastically during summer hot air temperatures, the spring discharge from the same basins does not decrease [10].
As a result of ongoing climate change, the idea that evapotranspiration from the floodplains can be neglected because the floodplain area is very small compared to the river’s catchment area is no longer valid for streams in the lower reaches of the Czech Republic. In the non-rainfall summer period, it is not true that the stream discharge on the CHMI profiles corresponds to the base flow. In contrast, on the Brzina, Loděnice, Bakovský stream, and Klenice, and apparently on many others, losses by evapotranspiration from the stream floodplain and water bodies are so significant (200–250 l/s per stream basin) that they exceed many times the residual measured discharge from the CHMI basins measured on the closing profiles of the Brzina, Loděnice, Bakovský stream, and Klenice (0–20 l/s). The vast majority of base flow thus evaporates and does not run off. In the dry summers of 2018 and 2019, total discharge on the CHMI profiles was thus up to two orders of magnitude lower than base flow from the same basins before it was consumed by evapotranspiration from floodplain vegetation [9] (Fig. 4). This phenomenon is well known from arid regions, where water from streams also massively disappears through evapotranspiration until the streams dry up completely. In a number of streams in the lower areas of the Czech Republic, even without water abstraction in the summer, residual discharge is below the legislative threshold, purely due to environmental phenomena (extreme temperatures, and thus extreme evapotranspiration). The summary updated report on the impact of climate change [11] confirms a significantly greater influence of evapotranspiration (greater water consumption by vegetation also due to the extension of the growing season) as a result of ongoing climate change.
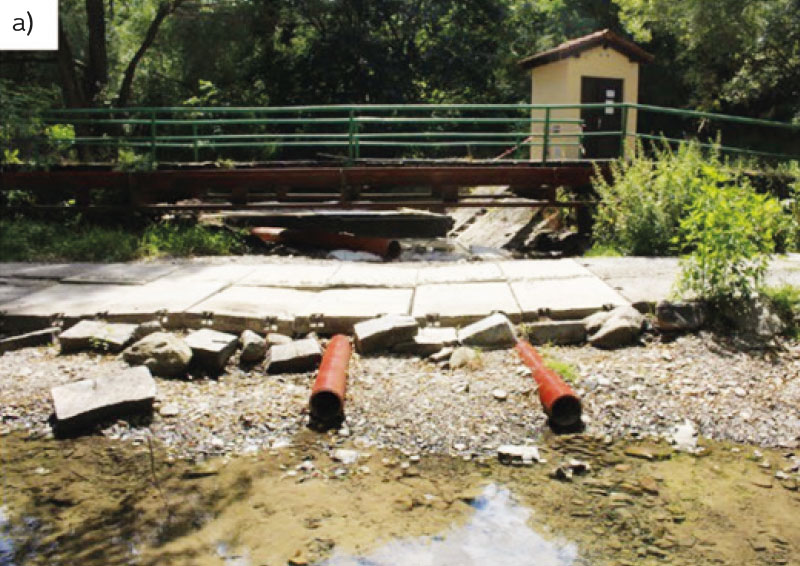
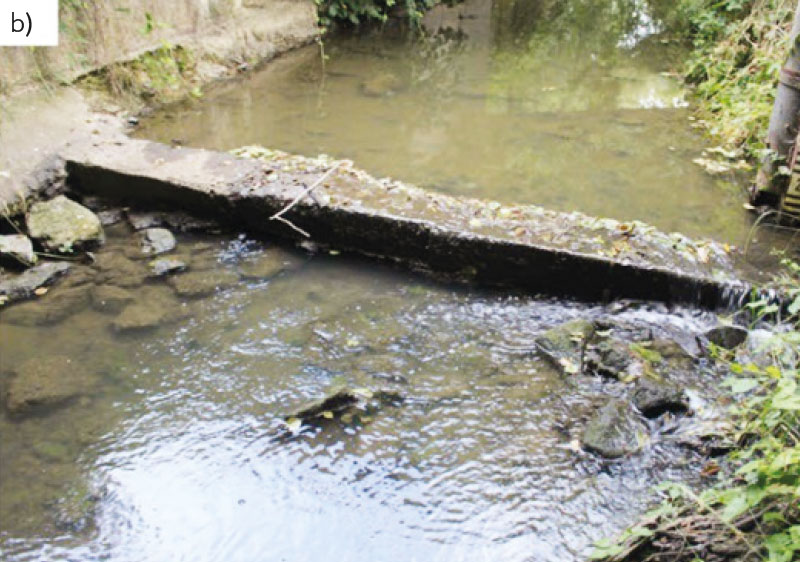
Fig. 4. Examples of extremely low flows on surface streams with catchments of about 100 km2. Runoff was temporarily drastically reduced as a result of massive evapotranspiration of groundwater from the river floodplain in dry and hot summer periods a) Brzina (Sedlčansko) 10 July 2019, flow rate 0 l/s, river basin 133 km2; b) Žehrovka (Březina) 9 July 2019, measured flow 20 l/s, basin 90 km2
In theory, discharge from wastewater treatment plants, which significantly increases stream discharge in conditions of long-term drought, could have a certain influence on the results [12]. However, a significant increase in discharge occurs during times of extreme evapotranspiration from the floodplain, when a large part of base flow is consumed by evapotranspiration in the floodplain which, on the contrary, leads to an extreme underestimation of base flow. The effect of these processes on base flow is thus opposite and the effect of reducing discharge by evapotranspiration in the floodplain is usually significantly higher than the contribution of discharge from wastewater treatment plants.
M index
For each CHMI gauging station, the M index was determined as the ratio of average base flow in the driest recorded year of 2010–2019 to average long-term base flow. The M index therefore indicates what part of average base flow forms the base flow in the driest year (Tab. 2).
Tab. 2. M index values
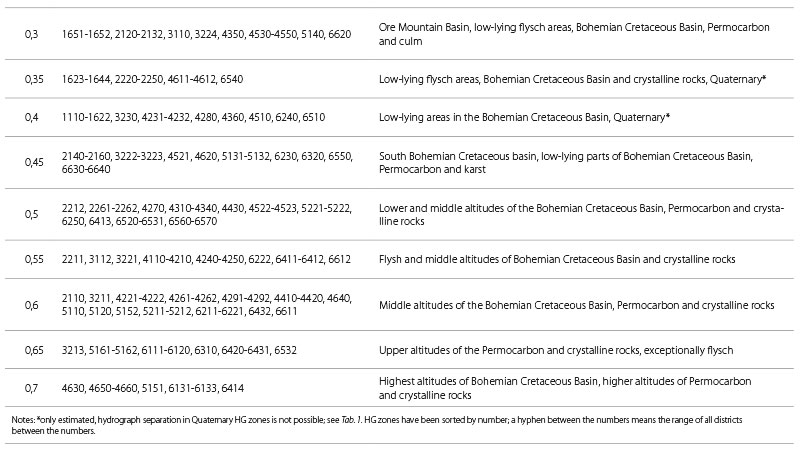
Tab. 2 shows the M index for all HGR in the Czech Republic derived from the separation of the hydrograph on the CHMI gauging stations. The lowest values of the M index are reached in the lowest altitudes of the Czech Republic, where significant groundwater recharge typically occurs after several dry years. This is also the reason why base flow in the dry season can drop, for example, to 30 % of average base flow at the same gauging station. Conversely, in the highest altitudes, where annual recharge prevails over multi-year oscillations, the drop in base flow in the dry season is naturally smaller, to 70 % of the value of average base flow. Unlike BFI, which is significantly related to lithology, the M index is mainly influenced by altitude. The influence of lithology should be assessed in future studies. The limited influence of lithology is evident, for example, at M = 0.45, which is valid both for very little permeable flysch rock and the most permeable Bohemian Cretaceous Basin aquifers with a strong storage capacity. It is obvious that the storage capacity of the rock environment has only a limited effect on M index; for example, at HGR 4521 Cretaceous rocks in the Košátecký stream basin, although the porosity is able to absorb almost all the quick flow and convert it into base flow (BFI 0.9), this porosity is however not capable to sustain the stable discharge for several years so that discharge would not fluctuate between dry and wet years.
Therefore, the regularity of groundwater recharge from rainfall has a much greater influence on the stability of runoff in multi-year cycles. At higher altitudes, the groundwater recharge is more regular, as the capillary water storage in the soil is recharged every year, and infiltration can thus proceed to greater depths and groundwater recharge is significant each year. In contrast, in the lowlands, the soil water deficit can last several years, and significant groundwater recharge occurs only after many years (e.g. after seven years in the case of Slánsko), when the base flow has already dropped to values significantly below average.
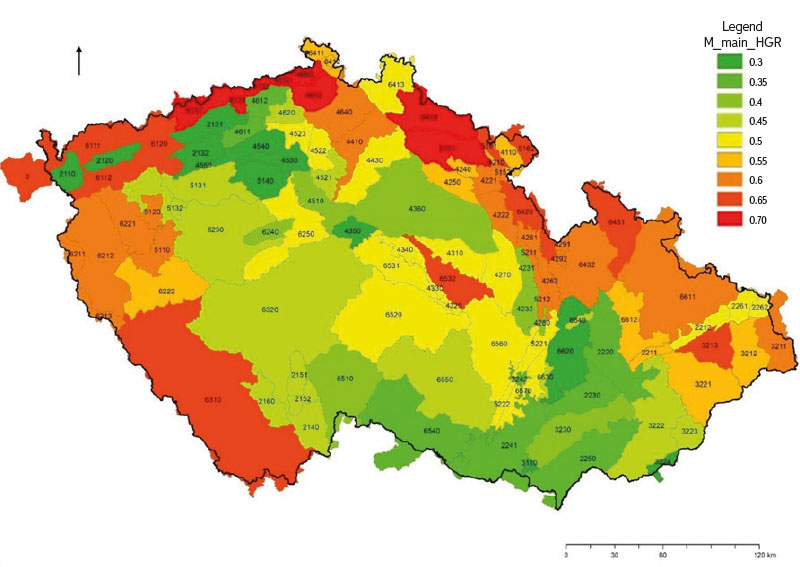
Fig. 5. Index M determined by hydrograph separation from 518 surface streams assigned to HGR in the base layer
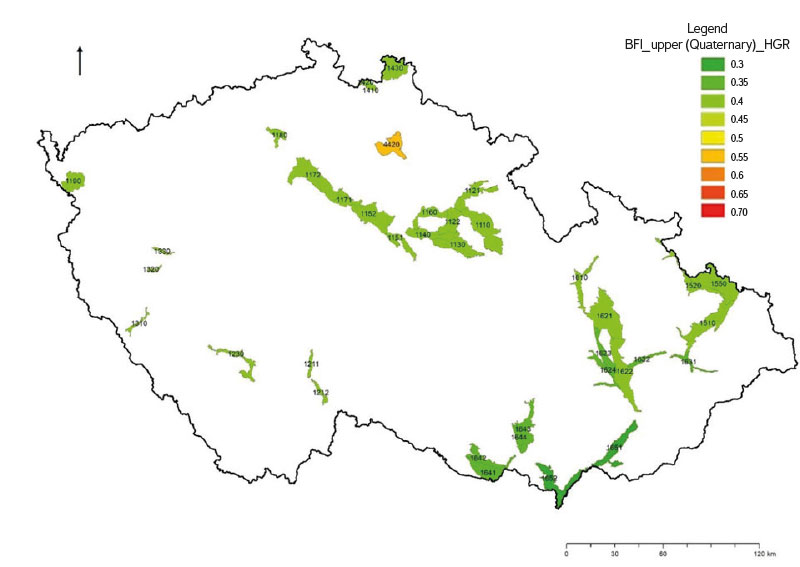
Fig. 6. Index M assigned to individual HGR in the upper layer (Tab. 2)
Derivation of base flow from longterm precipitation totals
In an ideal situation, every area in the Czech Republic would belong to a given basin with a gauging station. By separating the hydrograph on a given CHMI gauging profile, it would be possible to directly determine both the average base flow and the base flow in the dry season. In reality, however, this approach cannot be used in almost half of the Czech Republic, because:
- many rivers originate in border mountain ranges, and the CHMI gauging profiles in the lowlands located on these rivers (e.g. the Labe) do not reflect the conditions of formation of base flow in the lowlands, but rather the conditions prevailing in the source area (significantly higher altitudes, and therefore higher discharge than the one in the intercatchment area of a gauging station);
- Quaternary fluvial aquifer, with some exceptions, drain into large streams. Base flow from Quaternary fluvial aquifers cannot be determined by measurement below and above aquifer because the increase in stream discharge due to inflow from aquifer is much lower than the measurement error of a large
stream.
Therefore, for a significant part of the Czech Republic, base flow cannot be determined by separating the hydrograph on existing profiles. It was therefore necessary to determine base flow indirectly from parameters that are available in the entire Czech Republic. The most appropriate parameter is the long-term average precipitation total, available at a resolution of 1 km2 (30-year precipitation normal, CHMI). Long-term average precipitation changes gradually in space without sharp changes. The relatively close relationship between long-term average precipitation and total runoff is well known [13].
The close relationship between average long-term rainfall and total runoff based on the analysis of 65 CHMI basins is described in [14]. Average total runoff can be calculated from average precipitation according to the following equation:

where:
COprům is total average runoff (mm/year)
(precipitation) average rainfall (mm/year); in both cases it is a long-term average
The coefficient of determination was 0.97, the root mean square error 7.9 %.
The equation cannot be used for precipitation lower than 450 mm/year because the equation no longer correctly reflects the rainfall-runoff relationship.
After converting to other discharge units, the [14] equation has the following form:

where:
COprům is total average runoff (l/s/km2)
(precipitation) average rainfall (mm/year), again in a long-term average
In 2011, in cooperation with R. Vlnas, the influence of geology on total runoff and base flow was studied. Profiles that did not have one predominant geological unit, as well as those that had obvious in/out flow of water from/to other basins, were omitted from the monitored CHMI gauging profiles. The resulting 138 basins were divided into the following five groups according to geology: crystalline rocks, culm (Lower Carboniferous sediments in Moravia), Carboniferous to Permian, Bohemian Cretaceous Basin, flysch [15].
In the case of total runoff, it was found out that, with the exception of flysch, all basins have the same relationship to the long-term average total precipitation, which can thus be expressed by a single equation; only flysch rocks show lower discharge at the same precipitation total (Fig. 7 ). The reason for the difference in flysch is apparently climatic, not geological. Flysch rocks are found only in the Carpathians, on the border with Slovakia, while other rocks are found in the wider area of the Czech Republic, i.e. their average location differs by up to hundreds of kilometres. Flysch is in a geographically different area in more continental conditions than the average of the other basins. The analysis showed that, in order to determine total runoff, it is sufficient to divide basins in the Czech Republic into just two groups. For all HGR except flysch, average total runoff can be determined from average long-term precipitation from the relationship in Fig. 8, while for flysch HGR, the relationship is shown in Fig. 9. A comparison of these regression equations with equation [13] is shown in Fig. 10.
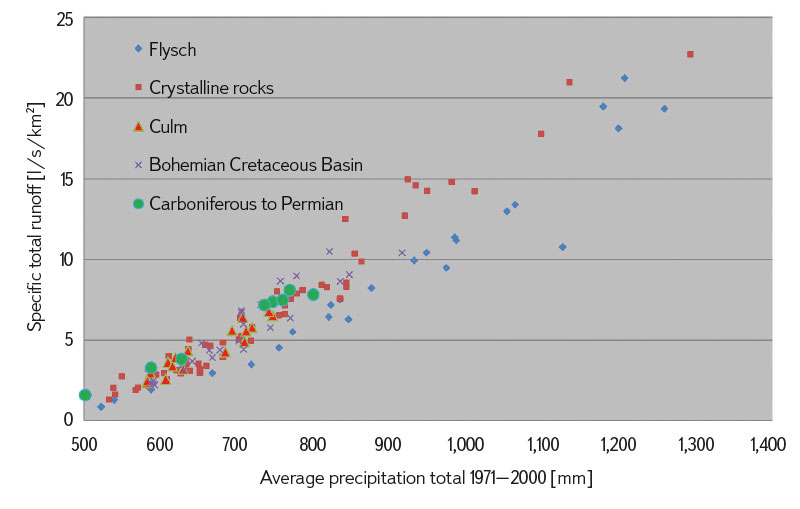
Fig. 7. Influence of precipitation and geology on total flow for catchments monitored by CHMI [15]
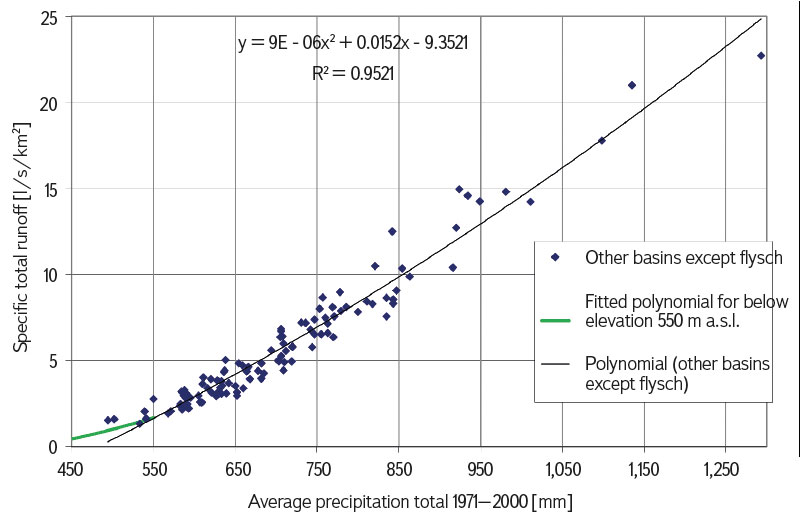
Fig. 8. Relationship between mean precipitation and total flow for all geological types of catchments other than flysch; the fitted polynomial underestimates flow for precipitation below 550 mm/year, and therefore for the lower precipitation total it is replaced by a polynomial for flysch (green line)
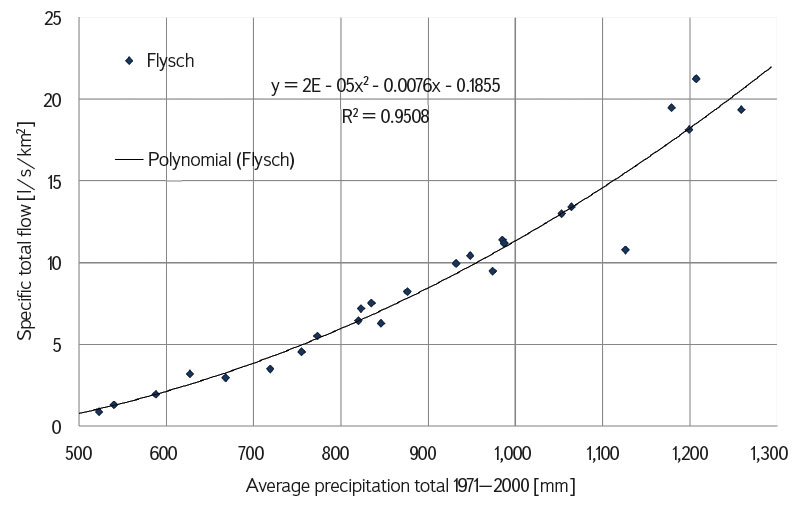
Fig. 9. Relationship between average precipitation and total flow for flysch
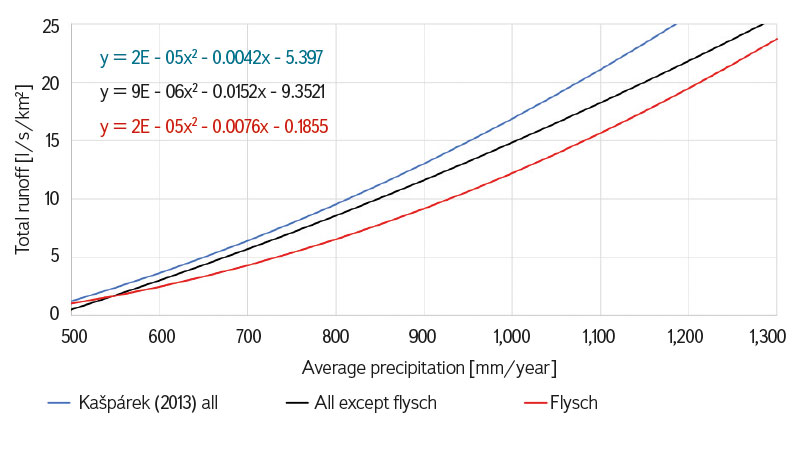
Fig. 10. Comparison of relationships for determination of total flow from precipitation. It is clear that the total flow from flysch catchments (red) is significantly lower than that of other catchments (black). In blue relationship according to formula [16 ]. The regression equation in Fig. 10 shows the parameters a, b, c in the form a × x2 + b × x + c
It is obvious that precipitation determines total runoff significantly. Geology does not matter with the exception of the flysch, whose basins show lower total runoff than other basins [15].
Average base flow was calculated from the following equation based on tight regression relationships with precipitation:
ZOprům is average base flow (l/s/km2)
(precipitation) long-term average total rainfall (mm/year)
BFI Base Flow Index (dimensionless)
a, b, c equation parameters (dimensionless) (Figs. 8, 9)
BFI for all HGR is listed in Tab. 1 and parameters (a, b, c) are shown in Figs. 8 and 9 in the form of regression equations. A similar procedure, i.e. obtaining total runoff from precipitation and then base flow by multiplying by BFI, was used by [16].
For flysch, the following equation is always used to calculate base flow:

For other HGR in the area with a normal rainfall above 550 mm/year, the following equation is used to calculate base flow:

For other HGR in the area with normal precipitation below 550 mm/year, the following equation is used to calculate base flow:

The resulting map of base flow is shown in Fig. 11. The values are slightly lower than in the map of base flow by Krásný et al. [2], which was constructed from data from the 1960s and 1970s (10- to 12-year series from 250 gauging stations) even before the reduction of base flow due to climate change.
Long-term average base flow (Fig. 11) is calculated from the long-term average total precipitation from Equation 33 (variants 3a, 3b, 3c) and the parameters from Fig. 5 and Tab. 1 (l/s/km2). It is clearly visible that in the Quaternary HG regions, base flow is higher than in many of the surrounding HGR thanks to higher BFI.
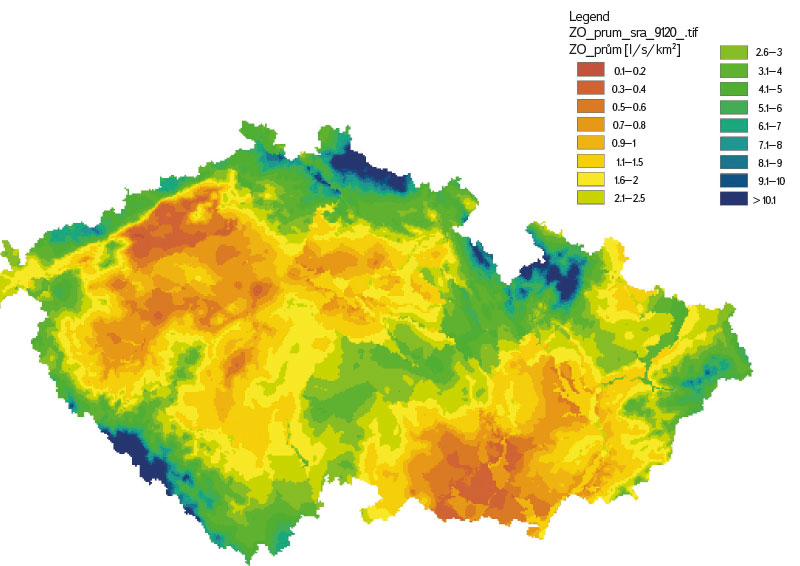
Fig. 11. Long-term average base flow (l/s/km2) derived from precipitation normal 1991–2020 using regression relationships and BFI index for individual zones. Map is available on: https://mapy.geology.cz/hydro_rajony/
Derivation of base flow in the dry season from precipitation
Base flow in the dry season was calculated according to the following formula:

where:
M is the minimum Base Flow Index (dimensionless) and is listed for all HGR in Tab. 2 (Figs. 5 and 6).
The boundaries of the colour scale categories are different in the ZOsucho map than in the ZO prům map due to optimal resolution of values. The maps thus looks like similar. However, the displayed values in both maps differ considerably
(cf. Figs. 11 and 12). Base flow values in the dry season are significantly lower than average base flow, especially at lower elevations.
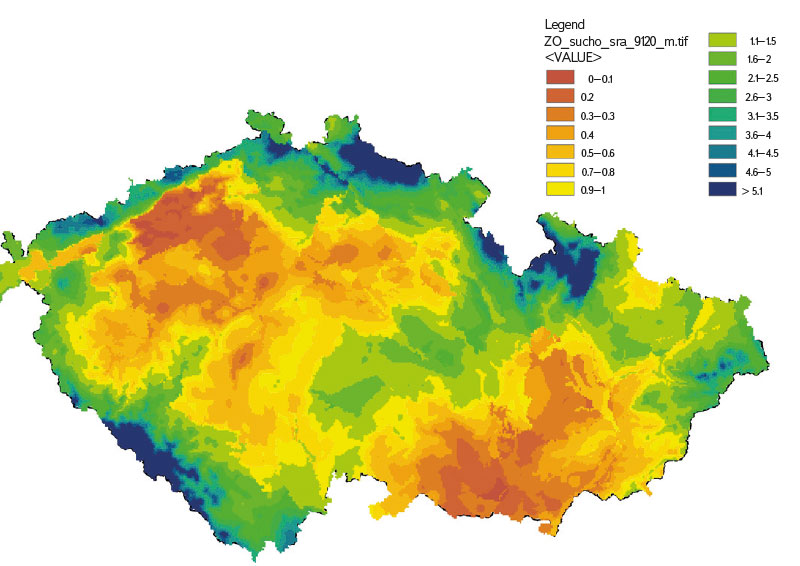
Fig. 12. Base flow in the dry season (l/s/km2) generated from precipitation normal 1991–2020 using regression relationships and BFI and M indices for individual zones. Map is available on: https://mapy.geology.cz/hydro_rajony/
BFI and M indices are multiplied together and their multiplication with total runoff gives base flow in the dry season. Therefore, the lowest base flow can be expected during drought in rocks with low permeability at the lowest altitudes
(e.g. flysch). Here, base flow in the dry season can reach as little as 10 % of average total runoff of a given area.
Groundwater abstraction and treated wastewater discharge of groundwater and surface water
Recorded groudwater abstraction and discharge of treated wastewater to surface water and groundwater (annual average) was taken from the HEIS point database and subsequently converted to l/s. Each point data is assigned to
a given area unit. For example, under individual fourth order basins or floodplains, and for each such unit, the amount of water abstracted from or discharged into a given unit was calculated as a differential of the sums of water abstraction and discharge back to environment.
While for environments A and B (HGR and fourth order basins) only groundwater abstraction and discharge were considered, for environment C (floodplain) surface water abstraction and discharge were also considered. For environment D (build-up parts of municipalities with predominant individual drinking water supply), only groundwater abstraction at the level of the number of inhabitants and average consumption per capita in the Czech Republic was considered. Individual groundwater abstraction and discharge was displayed in the resulting vulnerability map as point objects with different point diameters according to the volume of water abstraction, so that it is clear where exactly in a given unit the recorded water abstraction or discharge occurs.
Vulnerability of groundwater resources to drought
The resulting Map of Groundwater Vulnerability to Drought was generated by overlaying and combining several separate GIS layers. The main advantage of this procedure is the fact that a given existing network of units allows updating data, for example, on a change in recharge or, conversely, on a change in water abstraction and discharge, which leads to a change in the values of the units in the vulnerability map. In the future, it will be possible to update the map. For individual environment types, available groundwater resources after subtracting groundwater abstraction were determined in the following ways:
Determining vulnerability for fourth order basins and hydrogeological regions
For environments A and B (fourth order basins and HGR), vulnerability was determined according to the following formula:

where:
ZOsucho is base flow in the dry season (l/s/km2)
Op groundwater abstraction (l/s)
Vp discharge of treated wastewater to groundwater (l/s) (very rare)
Sp area of the fourth order basin or HG region (km2)
Bp symbol for the vulnerability of the fourth order basin area and the HG region
Base flow in the dry season (ZOsucho) was calculated from Equation 4 at a resolution of 1 km2. Where the groundwater flow in HGR forms a unified flow system (highly permeable aquifers, e.g. Bohemian Cretaceous Basin and South Bohemian Basin, Javoříčsko-Mladečský Karst), the hydrological balance was calculated for the entire HGR as the division into parts of the HGR would be highly subjective. Everywhere else, the balance was calculated in the fourth order
basin, thus much smaller area.
Determining vulnerability of floodplains
For environment C (floodplains), vulnerability was determined according to the following formula:

where:
ZO sucho is base flow in the dry season (l/s/km2)
K utilization factor (dimensionless), which was set to 0.5
O abstraction of both surface water and groundwater (l/s)
V discharge of treated wastewater to surface water and groundwater (l/s);
Sn area of floodplain segment (km2)
Sp area of the entire orographic basin whose water flows through the floodplain segment (km2)
Bn symbol for the vulnerability of a floodplain environment
Base flow was calculated as the average value of base flow from the fourth order basin and HGR in a floodplain orographic basin. Since the floodplain is in contact with the stream, in this case not only groundwater abstraction is considered, but also surface water abstraction and discharge of wastewater. Water abstraction and discharge were considered from the entire floodplain area and also in a strip of 250 m further (use of buffer).
The calculation therefore considers that 50 % (utilization factor) of all base flow in the dry season, formed in the entire area of the orographic basin of a given stream, is available for induced groundwater resources. Since a floodplain typically makes up only a few per cent of the stream orographic basin (about 2–5 % on average), potential induced groundwater resources from the entire basin per unit area of the floodplain are about 20 times higher than for other units. The category boundaries are therefore set differently for the floodplains. If the utilization factor K was 100 %, then the consumption of all base flow from the entire orographic basin would be considered only in a given floodplain segment. However, the orographic basin also accounts for floodplain segments further downstream, which are calculated separately, and such a procedure could lead to an overestimation of groundwater resources.
Determination of vulnerability for municipalities with predominant individual drinking water supply
Groundwater abstraction for individual household wells is not recorded; however, it can be derived from the number of inhabitants of a given municipality because, according to available data, daily average water consumption in the Czech Republic is around 100 l/person/day. Based on the experience of 2015–2020 (hydrological drought), individual groundwater abstraction in municipalities is also one of the most threatened by drought. Individual household wells are very often shallow and use the upper part of a near-surface aquifer where groundwater can only be obtained from the relatively close vicinity of a well. This especially applies to built-up areas, where individual plots are directly adjacent to each other and population density is so high that a sufficient supply of groundwater from precipitation per unit area cannot be guaranteed. This can be demonstrated by a simple calculation using the example of water consumption. The typical base flow in lower altitudes of the Czech Republic, where the majority of population lives and the majority of municipalities are located, does not exceed 1–2 l/s/km2 [2]. At the same time, base flow corresponds to average groundwater recharge. On 1,000 m2 of land, the recharge does not exceed 1–2 ml/s, which corresponds to 90–180 l/day. The average consumption is 100 l/person/day, so a relatively large plot of land with an area of 1,000 m2 is able to supply water to 1–2 people. At the same time, it is obvious that the plots are often significantly smaller and usually more than 1–2 people live on them. The above calculation is based on average long-term recharge from precipitation, not on the recharge in the dry season, when it decreases to half the average value or less at lower altitudes. From the above calculation, it is quite obvious that the drying up of wells in the summer period is inevitable in a number of municipalities as a result of ongoing climate change.
For environment D (municipality with predominantly individual drinking supply), vulnerability was determined according to the following formula:

where:
ZOsucho is base flow in the dry season obtained from the fourth order basin or from the HGR in which the village
is located (l/s/km2)
So area of the built-up part of the village (km2)
O average water consumption per inhabitant (0.0011 l/s, which corresponds to 100 l/person/day, and thus the average water consumption per inhabitant in the Czech Republic)
N number of inhabitants of a given municipality
Bo symbol for the vulnerability of the area of the municipality
The number of inhabitants of the municipality was taken from the layer https://csu.gov.cz/vysledky (2020 population census). Alternatively, data was found on the Czech Statistical Office website.
In the hydrological balance, it is therefore assumed that the groundwater source for a given municipality is only water that falls in the built-up part of a municipality, and that no water flows into the municipality from the wider surroundings. Furthermore, it is assumed that the amount of groundwater that is formed in the municipality is the same as the amount of groundwater that is formed in the average landscape around the municipality. Both of these assumptions are basically the worst possible scenario; a number of municipalities have infiltration facilities in the wider area as well, and groundwater flows into them from a larger area. However, there are also municipalities where the orographic basin coincides with the built-up area. In municipalities, more groundwater is clearly formed than in the surrounding landscape, thanks to a much lower density of vegetation and a higher proportion of impermeable surfaces, which are largely drained underground (in residential areas, there is an obligation to infiltrate rainwater on the land and water from a significant part of impermeable surfaces is infiltrated). The resulting hydrological balance therefore represents the worst-case scenario, and the actual result is on the safety side. The actual groundwater recharge in urban areas has not been measured and it is one of the most important unknowns that requires further study.
RESULTS – MAP OF GROUNDWATER VULNERABILITY TO DROUGHT
Vulnerability map categories
The resulting Map of Groundwater Drought Vulnerability (Fig. 13) is available at www.suchovkrajine.cz/zranitelnost-k-suchu, maps of average base flow and base flow in the dry season are available at: https://mapy.geology.cz/ hydro_rajony/
Fig. 13. Map of the Vulnerability of Natural Groundwater Resources to Drought. Vulnerability categories are determined from the numerical value of remaining groundwater resources in the dry season after subtraction of groundwater abstractions (l/s/km2). For floodplains, these are the values of potential remaining recharge from streams (l/s/km2)
The above-mentioned Map is divided into areas in six categories, quantitatively according to the balance (groundwater sources-abstraction/area), i.e. the balance normalized per unit of area:
- critical (red)
- very high (orange)
- high (yellow)
- medium (brown)
- low (green)
- very low (blue)
The following category boundaries apply to fourth order basins, HGR, and built-up parts of municipalities:
- Critical vulnerability (red) has a negative balance, which means that in a given area unit, more groundwater is consumed during the dry season than replenished by groundwater recharge.
- Natural resources are thus overexploited in the dry season.
- Very high vulnerability (orange) applies to areas where, after subtracting groundwater abstraction during the dry season, very low base flow remains below 0.2 l/s/km2.
- High vulnerability (yellow) is for areas where low base flow remains between 0.21–0.5 l/s/km2 after subtracting groundwater abstraction in dry season.
- Medium vulnerability (brown) applies to areas where base flow remains between 0.51–1 l/s/km2 after subtracting abstraction in dry season.
- Low vulnerability (green) is for areas where 1.01–2 l/s/km2 remains after subtracting groundwater abstraction in dry season.
- Very low vulnerability (blue) applies to areas where, after subtracting groundwater abstraction in dry season, there is over 2 l/s/km2 left.
For floodplains whose small area is contributed by inflowing groundwater from vast orographic basin by stream seepage (induced groundwater resources), the category boundaries are 20 times higher.
Representation of individual categories of vulnerability
Finally, the representation of critical and high vulnerability categories was calculated. For fourth order basins and HGR, the representation is expressed as the ratio of the area of a given unit falling into a given category to the area of
the Czech Republic (78,870 km2).
HGR occupy 16.7 % of the area. In the case of floodplains, it is the area of floodplains in a given category to their total area (5,584 km2). In the case of municipalities, it is the number of municipalities in a given category to the number
of municipalities with a predominant individual drinking water supply (a total of 1,726 municipalities).
For HGR and fourth order basins, 2 % of the territory falls into critical vulnerability, 5 % into very high vulnerability, and 22 % of the Czech Republic into high vulnerability (Tab. 3).
For floodplains, 3 % of the floodplain area is critically vulnerable, 13 % is very vulnerable, and another 17 % is highly vulnerable.
The situation is worst in municipalities with predominantly individual drinking water supply, where 93 % of the municipality’s territory falls under critical vulnerability, another 5 % under very high vulnerability, and 2 % under high
vulnerability.
SUMMARY AND DISCUSSION
The vulnerability of groundwater resources to drought determines not only the volume of dynamic groundwater resources, but also the degree of their current use, since the HGR with the largest groundwater resources often also has the largest groundwater abstraction. The purpose of the Map of Groundwater Vulnerability to Drought is an objective comparison of vulnerability of dynamic groundwater resources within the entire Czech Republic. This map is compiled in the form of a hydrologic balance of dynamic groundwater resources and groundwater abstraction based on base flow, base flow in the driest year of 2010–2019, HEIS data, PRVKUK for 2019, population, precipitation totals for 1991–2020, etc. The Map authors are aware that some information from publicly available sources may not correspond to the contemporary situation, for example from PRVKUK, which are updated over a multi-year time horizon and according to the needs of the respective region. The Map is designed so that GIS layers with variable information can be updated in the future.
For large aquifers, where the balance in the entire area is interconnected and the area cannot be meaningfully divided, HGR were the basic units. In hard rock and similar aquifers, the basic unit was the fourth order basin (much smaller areas). River and stream floodplains are assessed individually; here, the groundwater resource is also the water seeping of from streams from large orographic basins.
Total long-term average runoff in the Czech Republic closely correlates with long-term average total precipitation. From the long-term average total rainfall, average total runoff can therefore be fairly accurately determined for any place in the Czech Republic. The influence of geology on total runoff shows to be negligible.
On the other hand, for determining the base flow, the influence of geology is very important and it is necessary to consider different BFI values for individual HGR (see Tab. 1). Then, the average base flow was multiplied by the M index – that is, the ratio of the base flow in the driest year of 2010–2019 to the long-term average base flow, which was determined for all HGR (Tab. 2). In this way, base flow during the dry season was obtained (dynamic groundwater resources during the dry season). Based on the hydrologic balance, groundwater abstraction was subtracted from base flow during the dry season, and vulnerability of dynamic groundwater resources to drought was quantitatively determined based on the resulting remaining base flow. This procedure also considers the release of water from static reservoirs since base flow from areas with higher storage capacity tends to be more balanced, and thus discharge decreases less in dry periods.
Newly the information on groundwater resources on induced groundwater resources were obtained, which has not yet been recorded in the Czech Republic. The calculations also determined vulnerability of dynamic groundwater resources in built-up parts of municipalities with individual household wells, based on the number of inhabitants and the size of built-up area of the municipality.
The Map of Groundwater Vulnerability to Drought is a uniformly processed document that does not coverthe details and specifics of individual locations which could not be determined from the currently available documents. It should therefore be used for obtaining information with the knowledge that a detailed study specifying the groundwater resources for a specific location is needed, including the necessary field measurements.
In 2022, the article Balance of Groundwater Resources and Needs for Drinking Purposes in Conditions of Climate Change [17] was presented, which states the probable impact of climate change on the possibilities of abstracting groundwater for drinking purposes in 2041–2060 and processing the balance of the amount of groundwater of the current status, or for the third cycle of river asin plans, i.e. based on data for 2013–2018 (https://www.vtei.cz/2022/10/bilance-zdroju-podzemni-vody-a-potreb-pro-pitne-ucely-v-podminkach-klimaticke-zmeny/). The methodology is based on procedures of water management balance and assessment of the quantitative status of groundwater bodies in accordance with Decree No. 5/2011 Coll., as amended, considering the fact that the article contains three categories – compliant, conditionally compliant, and non-compliant.
When comparing Fig. 1 in document [16] with the Map of Groundwater Vulnerability to Drought, some areas of the corresponding HGR or their parts fall into the category of critical to high vulnerability of the rock environment to drought. The different methodological procedure in the evaluation of floodplain sediments is particularly evident in the upper HGR 1510 Quaternary of the Odra River, 1622 Plio-Pleistocene of the Upper Moravian Graben – southern part, 1623 Plio-Pleistocene of the Blata River, and 1652 Quaternary of the Morava and Dyje Rivers confluence area, which, compared to document [16], are a part of the low vulnerability of floodplain sediments.
The methodology for the creation of an interactive Map of Groundwater Vulnerability to Drought, in comparison with paper [16], does not use the methodology for evaluating the quantitative state of groundwater bodies, nor predicting the amount of dynamic groundwater resources in the Czech Republic. It calculates long-term base flow from precipitation for 1991–2020, considers BFI in the driest year of 2010–2019, fourth order basins, abstraction for individual drinking water supply in locations where there are no water works, and presents the values of the remaining specific dynamic groundwater resources in l/s/ km2 in the driest year of the five-year hydrological drought. The rating scale has six levels. Overall, it can be stated that the newly created Map of Groundwater Vulnerability to Drought provides a more detailed assessment of the current status and specific data on residual dynamic groundwater resources compared to document [17].
CONCLUSIONS
- The Map of Groundwater Drought Vulnerability is based on data available from the CHMI monitoring network, valid PRVKUK for individual regions as of 2020, from the HEIS database, and population records.
- The vulnerability of dynamic groundwater resources to drought was divided into six categories. The most fundamental is critical vulnerability, which means temporary over-exploitation of dynamic groundwater resources in the dry season, when the groundwater recharge is lower than the currently used amount of groundwater in a given area unit. Areas with this type of vulnerability should be given increased attention. The categories of very high and high vulnerability define areas with only small reserves of base flow, where problems may arise when climate change worsens, or in a period of multi-year hydrological drought.
- The Map shows that areas most at risk of drought are built-up areas of municipalities with individual groundwater supply; 93 % of these municipalities fall under critical vulnerability and another 5 % under very high vulnerability. In floodplain areas, critical vulnerability is only in 3 % of areas and very high in 13 % of areas. For HGR and fourth order basins, the areas of critical vulnerability reach 2 % of the area and high vulnerability 5 % of the area of the Czech Republic, and thus affect a small part of the country so far.
- The Map is designed so that layers with variable information can be updated in the future.
- The Map provides essential information for planning in the area of supplying the population with drinking water, targeting recharge programmes securing resources, and other elimination measures.
- This Map is available at www.suchovkrajine.cz/zranitelnost-k-suchu
Acknowledgements
This article was created on the basis of research carried out within the project SS01010208 “Controlled Groundwater Recharge as a Tool to Reduce the Impacts of Drought in the Czech Republic”, financed by the Environment for Life programme of the Technology Agency of the Czech Republic. For help with data sources, we thank Ing. A. Vizina, Ph.D., and Ing. M. Zrzavecký; for valuable comments on a preliminary version of the Map of Groundwater Drought Vulnerability and methodology we thank Ing. L. Kašpárek, CSc., RNDr. M. Milický, and RNDr. Z. Herrmann.
The Czech version of this article was peer-reviewed, the English version was translated from the Czech original by Environmental Translation Ltd.

