ABSTRACT
This study is focused on the calculation of parameter α of the wetting branch of the retention curve and on the influence of its value on the efficiency of capillary barriers. The capillary barrier is a simple method of insulating landfills. The effectiveness of the capillary barriers was tested using numerical models, which allow greater testing variability compared to physical measurement. Thanks to numerical models, it was possible to evaluate the direct effect of changing the parameters of retention curves on the functioning of capillary barriers. Hysteresis of retention curves was included in the construction of the numerical models, and then its effect on the agreement of the model results with the measured data was evaluated. Numerical modelling is a suitable and reliable tool for verifying the efficiency of capillary barriers. Due to the sensitivity of the results to the parameters of the task, it is necessary to determine as precisely as possible all the necessary input parameters so that the resulting model has real informative value.
INTRODUCTION
A capillary barrier, possibly in combination with another component [1], is an effective tool used to cover landfills and to protect an area against groundwater penetration. Its principle is based on the different hydraulic properties of two soil layers, usually different sands or sand and gravel. The finer-grained overlying layer composed of fine- to medium-grained sand is called the capillary layer. The bottom layer of coarser-grained material, usually medium-grained gravel, is called the capillary block. The interface between the capillary layer and the capillary block is referred to as the capillary interface. The hydraulic conductivity of the capillary layer is higher than the hydraulic conductivity of the capillary block under certain pressure conditions. This applies to lower pressure heads where the capillary block is almost impermeable. Thanks to this, the water flows through the capillary layer rather than penetrating into the capillary block [2, 3]. In some cases, to increase efficiency or for greater security, a simple capillary barrier is supplemented with a geotextile layer inserted at the capillary interface. Capillary barriers assembled in this way are called combined [4, 5]. A combined barrier is used in case of failure of a single capillary barrier.
The European Landfill Directive (Council Directive 1999/31/EC) requires the use of two independent components to cover Class II waste landfills. This is usually ensured by an artificial and mineral layer. An alternative is to use an artificial seal (geotextile) in combination with a capillary barrier. In this case, the artificial layer can be placed above or below the capillary barrier; however, inserting an artificial seal between the capillary block and the capillary layer is recommended by TASi (German: Technische Anleitung zur Verwertung, Behandlung und sonstigen Entsorgung von Siedlungsabfällen; Technical instructions for the recovery, treatment and other disposal of municipal waste). Compared to a classic combined seal, the combined capillary barrier created in this way is cheaper, has more structural advantages, and is less prone to damage by consolidation. Only the minimum slope requirement remains [6–8, 1].
The basis of the water flow mathematical model in the generally unsaturated zone is the Richards equation. However, the equation alone is not enough to correctly define the issue; two constitutive relationships need to be supplied, namely hydraulic conductivity and retention curve. Since the retention curve can be considered a simple function in a certain sense, i.e. when hysteresis is included, we have two options: the diffusion and the capacitance form of the Richards equation. In most cases, the capacitance form, which we will continue to work with, is more suitable.
In general, the retention curve is not a simple function; the relationship between pressure head and moisture is characterized by hysteresis. When designing and testing capillary barriers, hysteresis is often neglected [4, 9]; however, more detailed studies show that it has a non-negligible effect on its efficiency [10–13].
Experimental determination of the retention curve is not simple; as a rule, only the main drainage branch is determined. Much more demanding measurement of the wetting branch is not available. If we use the drainage branch of the retention curve in flow modelling, we overestimate the efficiency of the barrier. Since the loading of the capillary interface (and its possible breaking) occurs with increasing moisture in the capillary layer, it is more correct to include hysteresis in the model. Below we describe in detail how we implemented the wetting branch in the mathematical models used.
This study focuses on determining parameter α for the wetting branch of the retention curve (i.e. αw) and its influence on the efficiency of capillary barriers. In addition to the standard relationship between parameters α of the wetting and drainage branches, αw=2αd [14], an analogy was also used based on the results of measurements of the drainage and wetting branches of the retention curve performed by Trpkošová [15]. The calculation of parameter αw was dealt with by Likos et al. [16], when they determined the van Genuchten parameters α, m, and n from the results of experiments with the wetting branch.
Numerical modelling is used to test capillary barrier effectiveness at different values of parameter α. Due to the difficulty of experimental testing of capillary barriers, the repeatedly proven fact that mathematical models are efficient and accurate enough to reliably simulate experimental measurements is used; see for example [1, 17–20]. Using separate models for the main drainage and main wetting branches of the retention curve, it was also possible to evaluate the potential influence of hysteresis on the functioning of capillary barriers.
Hydromechanical characteristics of the environment
To numerically model the flow of water in capillary barriers, we use the capacitance form of the Richards equation in two spatial variables. The constitutive relationships used are the hydraulic conductivity K(h) and the retention curve in the form θ(h), where h is the pressure head and θ is moisture.
Richards equation is thus expressed as follows:

where:
C(h) = ∂θ / ∂h [L-1] is capacitance function
t [T] time
x1, x2 [L] Cartesian coordinateskartézské souřadnice
x2 axis placed vertically upwards
The retention curve is an equilibrium constitutional relationship indicating the value of moisture as a function of pressure head. To express it, van Genuchten equation [21] is usually used:
where:
θr a θs [-] are residual and saturated moisture
α [L-1], m [-] a n [-] van Genuchten parameters
In general, α > 0, m ε (1;0) and n > 1 applies. As a rule, we also assume m = 1-1/n.
The RETC program [22] is used to determine these parameters from the measured data of the retention curve.
Pro stanovení těchto parametrů z měřených dat retenční křivky slouží program RETC [22].
In the numerical simulations carried out in this study, the usual distribution model was used to express the dependence of hydraulic conductivity on pressure head:

where:

viz [23, 21].
Hydraulic conductivity enters the capacitance form of the Richards equation as follows:

which we get by substituting the appropriate branch of the retention curve (2) into Equation 3.
The course of wetting and the course of drainage are not determined by a single function. General change in moisture depends on the ongoing process (increasing or decreasing pressure head) and on the values of moisture and pressure head at the turning points; the introduction of hysteresis into the mathematical flow model means the loss of the unambiguity of the function θ(h). A simple, yet sufficiently reliable hysteresis model is presented in the article [24]. The model uses the simplification θrr = θrw = θr, nd = nw = n and αd < αw [25]. Here, and later, the superscripts d and w indicate the drainage and wetting branches. The authors further introduce into Equation 2 a non-zero input air value according to [26], the relationship αw = 2αd and the assumption that no air is closed in the pores during the wetting phases, i.e. that θrd = θrw = θr applies. Drainage or wetting branches of higher orders of the retention curve then receive a simple linear transformation based for a given turning point on the difference between the values of the current moisture and the moisture given by the main drainage branch for the current pressure head, or on the difference between the values of the current moisture and the moisture given by the main wetting branch for the current pressure head. For the needs of this article, it is important that the proposed method gives, in the case of the main drainage and main wetting branches, not only different air input values, but also different values of pressure heads of the inflection point of both branches.
In this study, we consider the retention curve as a unique function given by the main wetting branch. This corresponds to the above fact that the critical process in the capillary barrier is the increasing pressure head. Since in each phase of the real process, at a given value of pressure heads, the moisture is equal to or higher than the moisture given by the main wetting branch, the hydraulic conductivity of the capillary layer may be somewhat underestimated by the given simplification, and thus the efficiency of the capillary barrier may be underestimated as well. However, comparison of the results with the available experiments shows very good agreement and confirms the reliability of the method used. Moreover, this finding is consistent with the conclusions presented in the publication [24].
METHODOLOGY
Studied materials and their parameters
For the purpose of this study, one real, well-documented capillary barrier was taken to serve as a standard for comparison with other variants, and one hypothetical material was generated as a suitable alternative capillary layer. The three basic materials thus obtained, two different capillary layers and one capillary block, were then used to create several possible variants of the main wetting branches (still with the possibility of comparison with the measured wetting branch) generated according to the rules stated in the professional literature. The initial materials of the capillary layer and the capillary block were taken from the documentation of the capillary barrier experimental testing carried out at Ruhr University Bochum [27] and the laboratory measurement of the used materials carried out at the Faculty of Science of the Charles University [1, 28]. For the capillary block, it is a homogeneous material (hereinafter referred to as B0) with a grain size of 2–8 mm. According to Powers’ classification [29], it is in the “subrounded” category; particles have well rounded edges and less rounded vertices. For the capillary layer, it is a material (hereinafter referred to as Lo) created in the river environment, from which calcareous parts and larger grains have been removed. According to Powers’ classification, it belongs to the “rounded” category; the particles have rounded edges as well as vertices.
Using the tension apparatus designed according to Havlíček and Myslivec [30], the drainage and wetting branches of the retention curves for both materials were measured. Based on this, it was possible to use the obtained characteristics to compare the numerical results with the results of laboratory measurements in a tipping trough and subsequently, after confirming the reliability of the numerical simulations, to evaluate the influence of hysteresis in the mathematical modelling of capillary barriers. Main drainage, or the main wetting branch of the capillary layer material, are referred to as Lod or Low , respectively. Similarly, we refer to the main drainage branch and the main wetting branch of the capillary block as Bod and Bow.
In order to further study the influence of the capillary layer parameters on the barrier efficiency, using Rosetta software [31], a proprietary capillary layer material marked L1 was generated and defined by a set of parameters θr, θsd, αd, nd so that the material determined by these parameters meets the requirements for capillary layer material with its granular properties according to Pícha [2].
The unsaturated hydraulic conductivity of the tested materials was determined using Equation (5), with saturated conductivity Ks = 1.18 × 10⁻⁴ m/s taken from material L0. The hydraulic conductivities of materials L1 and B1 of the capillary layer and the block corresponding to the drainage branches of the retention curves are shown in Fig. 1. The graph shows how the two functions differ and how their difference changes with changing pressure head.
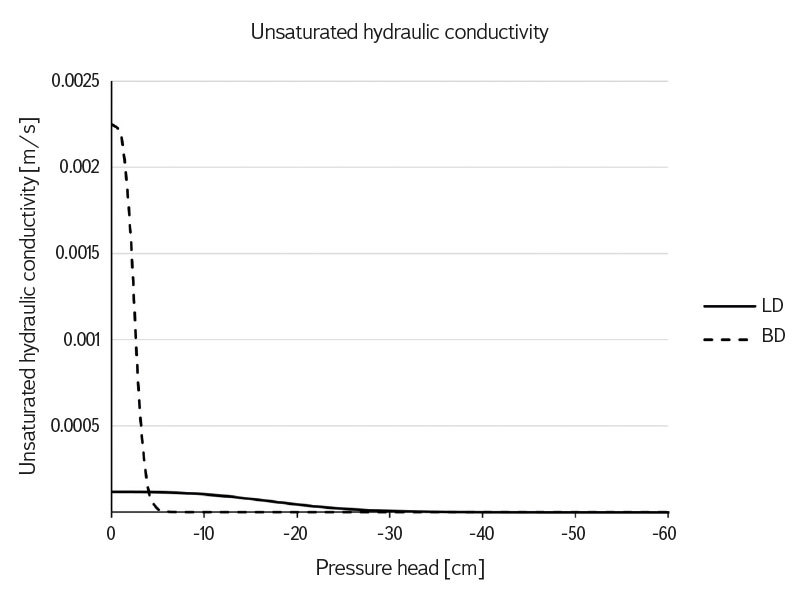
Fig. 1. Unsaturated hydraulic conductivity of the capillary barrier. The curve of dependence unsaturated hydraulic conductivity on the pressure head for capillary layer LD and capillary block BD. The data correspond to the drainage branch of the retention curve
Given that, in general, it is not possible to neglect hysteresis in the mathematical model of the capillary barrier and work only with the main drainage branch, in this study we focus in more detail on the construction of the main wetting branch from the usually measured parameters of the drainage branch, specifically the possibility of changing only the α parameter [14, 24].
In general, αw > αd applies. Two basic approaches for determining αw parameters were considered. In the first case, the results of laboratory measurements from previous studies [11] were used and the interrelationship of parameters α of the wetting and drainage branches of the retention curve was evaluated. The measurement results show the conversion relationship αw = 1.1αd for the capillary block and αw = 1.4αd for the capillary layer. Furthermore, the abovecited relationship αw = 2αd according to Scott et al. was examined [14].
The input parameters of the numerical models for the drainage and wetting branches of the retention curves of the studied capillary barrier materials are summarized in Tab. 1.
Tab. 1. Parameters of the tested materials

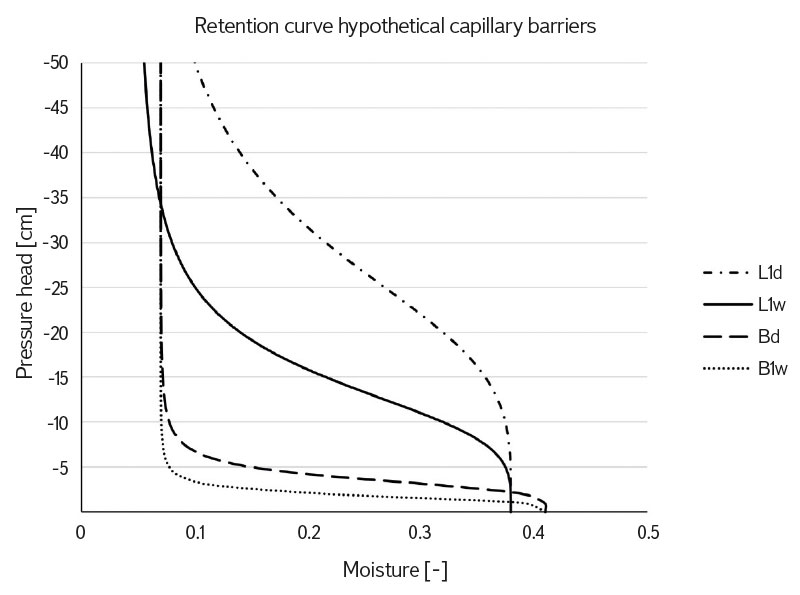
To obtain the parameters αw and nw from the known parameters αd and nd, we therefore chose the simplification nd = nw proposed in the study by Dohnal et al. [24], where its sufficient accuracy is confirmed by comparing numerical simulations with experimental measurements. It follows from the given data that only the values of parameter α for the wetting branch of the retention curve were changed. Variant No. 1 corresponds to the use of the relationship αw = 2αd according to [14]. For variant No. 2, the conversion relationship αw = 1.4αd was used for both the capillary layer and the block. In variant No. 3, the relationships αw = 1.4αd for the capillary layer and αw = 1.1αd for the capillary block were considered. The retention curves of the studied materials corresponding to the aforementioned variants of parameter αw of the capillary layer and the capillary block of the barrier are shown in Figs. 2 and 3. The differences between the drainage and wetting branches are visible in them.
For comparison, Fig. 4 shows the wetting branches of the capillary block retention curve according to the change in parameter αw.
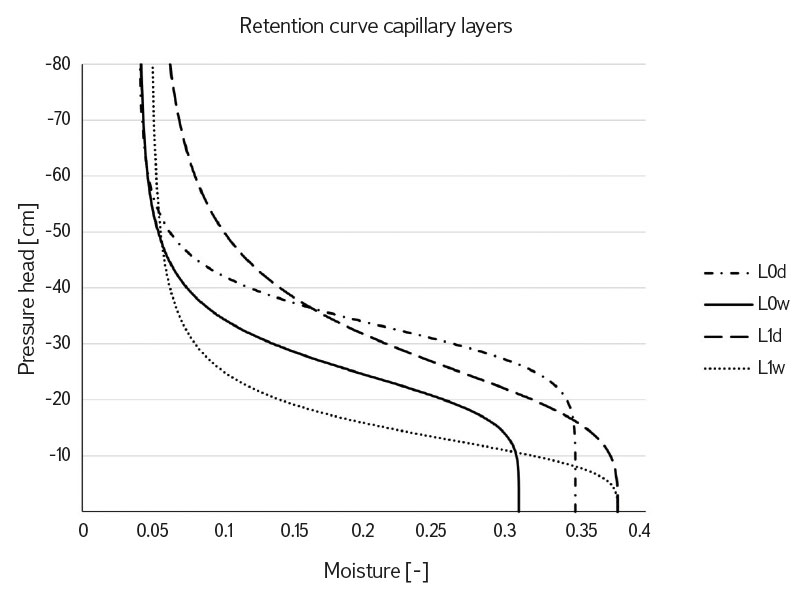
Fig. 2. Main drainage and main wetting branches of the retention curve of real (L0) and composed (L1) capillary-layer materials
Fig. 3. Retention curve hysteresis of capillary layer and capillary block of the hypothetical capillary barrier. Curves L1d and Bd represent the drainage branch of the retention curves of the capillary layer and the capillary block; L1w and B1w depict the wetting branch of the retention curves of the capillary layer and the capillary block
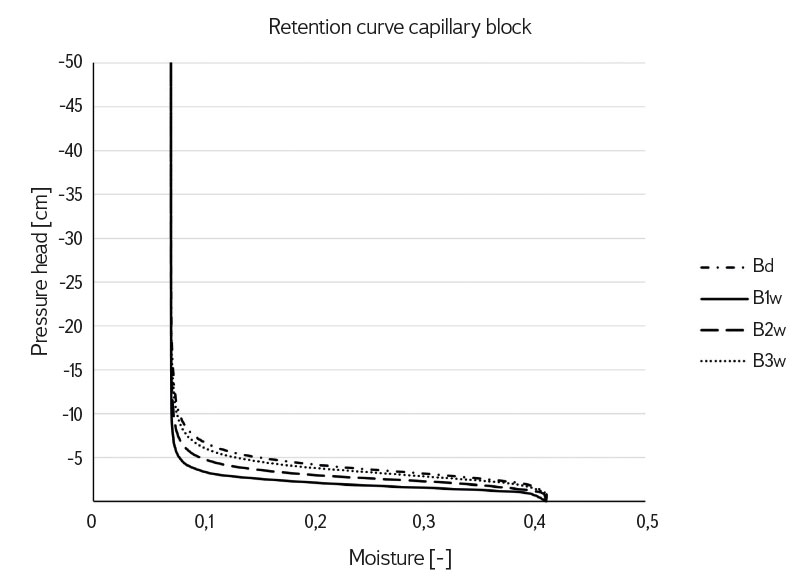
Fig. 4. Capillary block retention curves with different values for parameter αw. Comparison of the capillary block retention curves for draining branch BD and the three variants B1w, B2w and B3w of the wetting branch reflecting the changes in the parameter αw
Influence of parameter α on models of capillary barriers
We can consider parameter α as a decisive factor in expressing change in the retention curve when changing the process from drying to wetting and vice versa. Experimentally measured data of the main wetting branches of materials B0 and L0 [1] made it possible to determine the parameters of these main wetting branches using the RETC program. In addition to the closed air effect, changes were recorded not only in parameter α, but also in parameter n, compared to the corresponding main drainage branch. However, this could be due to the fact that the main drainage branch was not considered. Research on processes in which the direction of moisture change repeatedly altered [24] shows that the mathematical model including hysteresis using parameters αd, αw and nd gives a sufficiently accurate simulation of processes involving both directions of moisture change.
As we focused on the influence of the choice of parameter αw on the efficiency of the capillary barrier, we worked with numerical models of several variants of this choice. Mathematical models were formulated in two spatial variables (in a vertical section guided by the barrier fall line). The S2D_dual program [32] was used for the calculations, which solves the capacitance form of the Richards equation using the finite element method. With the help of numerical models, it was possible to follow the development of irrigation in space and time depending on the changing parameters. A capillary barrier model with basic values of hydromechanical characteristics was built. The initial pressure head was set to -40 cm [1]. Boundary conditions vary depending on the boundary location. At the point of infiltration, a Neumann boundary condition corresponding to a linearly increasing value of irrigation was set, thanks to which it was possible to compare individual versions of the models and to evaluate the time of breaking the capillary barrier affected by the changing parameters. Outflow from the capillary barrier was modelled using the Seepage face boundary condition at the drainage points of the capillary barrier. A zero Neumann boundary condition was set at the remaining edge of the modelled area, which is represented by an impermeable boundary. The boundary conditions are shown in Fig. 5.
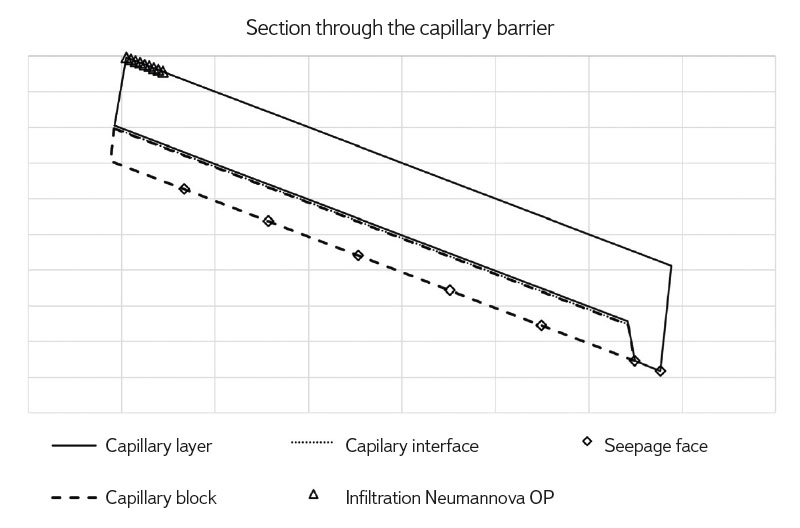
Fig. 5. Section through the capillary barrier with marked boundary conditions for infiltration corresponding to the non-zero Neumann boundary condition and drainage from the capillary block as a Seepage face boundary condition. The remaining part of the boundary is the zero Neumann boundary condition. The length of the capillary barrier is 6 m and the height is 60 cm
Irrigation was identical for all calculated variants so that the outputs could be compared. The drainage and wetting branches of the retention curve were modelled as separate versions of the models with different input parameters. It was therefore possible to evaluate and verify the influence of hysteresis and the choice of parameter αw on the functioning of capillary barriers in all modelled variants (Fig. 6).
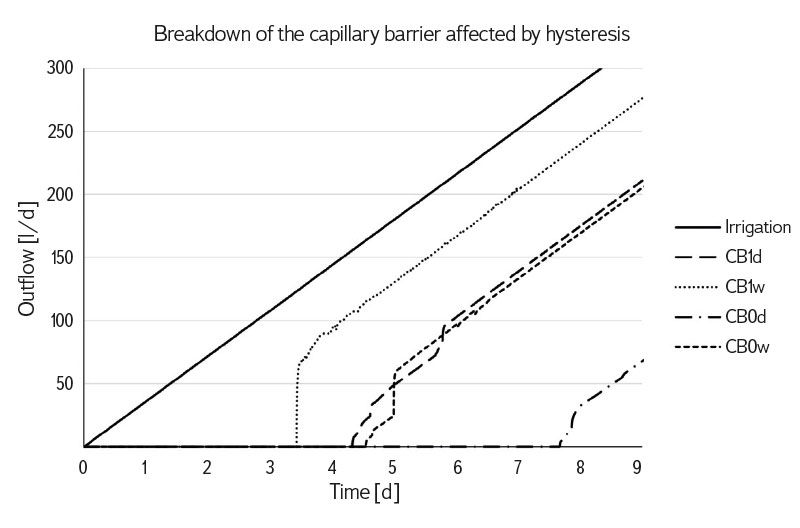
Fig. 6. Capillary barrier efficiency affected by hysteresis. The graph shows linearly increasing irrigation (the same for all simulations), outflow from capillary block CB0d and CB0w for the drainage and wetting branch of the default capillary barrier retention curve, and CB1d and CB1w for the drainage and wetting branch of the retention curve of variant 1 of the hypothetical capillary barrier according to Scott et al. [14]
In addition to the basic variant of the capillary barrier model for the drainage branches of the retention curve, three variants were modelled for the wetting branches of the retention curve. The calculation variants for different wetting branches are based on the changing parameter αw of the wetting branch of the capillary layer retention curve, possibly also of the block. The results are shown in Fig. 7.
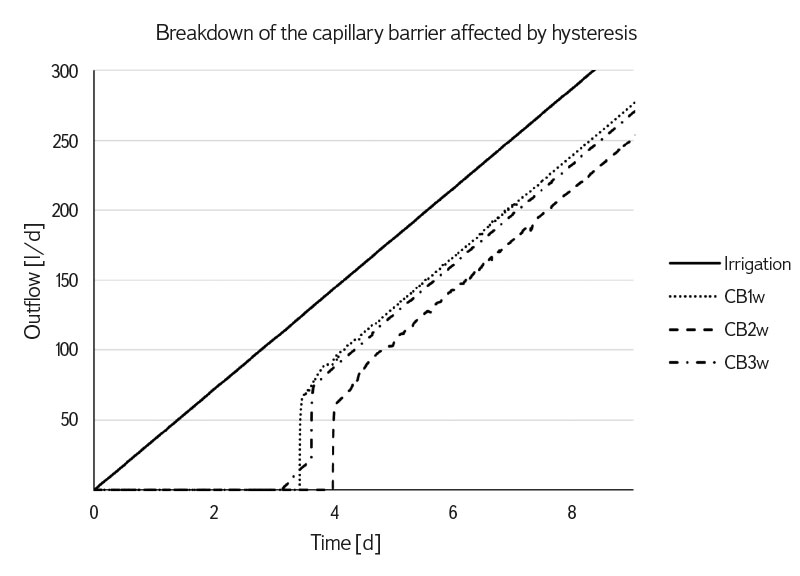
Fig. 7. Capillary barrier efficiency depending on the choice of parameter αw of the retention curve wetting branch. Irrigation in the chart shows a linearly increasing intensity of irrigation; wetting curves 1, 2, and 3 correspond to the outflow from the capillary block for three variants of calculation αw of the wetting branch retention curve
DISCUSSION AND CONCLUSION
In this study, we compared the efficiency of several capillary barriers that differed in the capillary layer determined by the tested choices of parameter α. Since the results of experimental tests are available for the starting material, we were able to confirm that the mathematical model of the barrier gives sufficiently accurate results even when using the main wetting branch alone. Comparison with experimental results further showed that, in the case of barrier efficiency, one cannot neglect hysteresis and only work with the capillary barrier drainage branch. Previous experiments [11, 28] were thus confirmed.
A series of tests focused on derivation of the main wetting branch in known (i.e. measured) parameters of the main drainage branch showed that determination of the αw parameter plays an important role in this step, and that it is even possible, as suggested by the cited publications, to keep parameters θrd, nd, possibly also θsd, and define the main drainage branch only with a suitably determined parameter αw. It transpires that the initially proposed (and in some cases proven) choice αw = 2αd may not be the best solution. In the case of the initial barrier B0, L0, it is obvious that parameter αw chosen in this way could lead to underestimating the barrier efficiency.
It is evident from the results that the most accurate determination of the retention curve parameters plays an essential role in determining capillary barrier efficiency. If we have two physically existing materials, a capillary block and a capillary layer, and we want to determine the effectiveness of the capillary barrier created by them, then we can rely on a test performed by a mathematical model. In this case, the parameters of the main drainage branch are sufficient for the capillary block. For the capillary layer, due to the sensitivity of the result to the value of parameter αw, it is advisable to determine the parameters of the main wetting branch by measurement. If we only have the parameters of the main drainage branch at our disposal, it is appropriate to use a model of the main wetting branch based on changing only parameter α. The results of this study show that in such a case, a suitable value for αw should be chosen in the interval 1,1 αd ≤ αw ≤ αd.
Acknowledgements
The project “Hydromechanical characteristics of retention curves and their influence on groundwater flow” was financed by the Grant Agency of Charles University under number 296215.
The Czech version of this article was peer-reviewed, the English version was translated from the Czech original by Environmental Translation Ltd.
