ABSTRACT
Knowledge of catchment runoff values is the key to a wide range of engineering and scientific applications. However, direct measurements in the scope of all fourth-order catchments in the Czech Republic are not realistic. Standard methods for estimating these parameters are local regression models, rainfall-runoff models, or other interpolation techniques. Regression models provide reliable results, but the derivation of local regression equations is demanding on the amount of input and reference data. Rainfall-runoff models have their application in design activities at a local scale. Their application in the Czech Republic is not trivial and requires knowledge of precipitation distribution. Interpolation techniques provide a fast but often less reliable approach. Most of these interpolations are not primarily intended for hydrological applications; the exception is the Top-Kriging method. It is based on kriging methods used in geostatistics, which it extends in many directions in order to affect hydrological regularities, especially the concentration of runoff in the river network. This method has been successfully used in Austria or France to estimate discharge rates in ungauged branches of the river network. However, is this method also suitable for use within the Czech Republic? Our results show that the heterogeneity of the catchments, especially in the mountainous and foothill areas of Šumava, significantly reduces the Top-Kriging performance. Additional transformation of the results can improve its performance in the case of some discharge rates. However, compared to direct calculations, Top-Kriging lags behind.
INTRODUCTION
Knowledge of hydrological parameters, such as the long-term average outflows actual river discharge, is a key factor for flood risk management, landscape planning, and a number of scientific or engineering applications. Sufficient amount of surface water is a topic currently being addressed in connection with the changing climate, and its availability is essential for adapting to new environmental conditions.
The basic hydrological unit for which hydrological data is required is the fourth-order catchment. There are over 8,500 such catchments in the Czech Republic. For the vast majority of them, data on their water content is not available. The unavailability of these data is largely linked to the issue of data collection, especially to the limited number of limnigraphic stations. The largest hydrological monitoring network in the Czech Republic is operated by the Czech Hydrometeorological Institute (CHMI), which currently has around 550 stations. The increase in the number of stations is primarily limited by the financial complexity of their establishment and operation.
Another possibility to obtain the required hydrological data is various types of hydrological estimates, predictions, and analogies. Estimation of variables related to catchment runoff is usually based on regression methods between the variable and selected catchment characteristics. When estimating within large or highly heterogeneous catchments, it is usually divided into several areas. Regression parameters are determined for individual areas separately [1]. Another approach is estimation using rainfall-runoff models, which are usually demanding on the amount of input data, compilation time, and calculation time. However, they are used with success on a local scale and in design activities [2]. The last possibility is the use of spatial interpolations. It is a quick and relatively simple approach. However, the disadvantage is the lower quality of the estimate, often resulting from disregarding the hydrological topology in the relations between catchments and sub-catchments. Interpolation is controlled primarily by the Euclidean distance between the interpolated location and the location where the given variable is known [3, 4]. In the international field, the PUB (Prediction in Ungauged Basins) initiative deals with hydrological prediction in ungauged catchments, for example. The aim of the activities is to create a better scientific basis in the field of hydrological modelling, to reduce uncertainties in prediction, and to search for new approaches [5]. The most important institution that deals with hydrological predictions in the Czech Republic is the CHMI. It normally uses the method of regional regression models for its predictions of water distribution in a catchment [6].
A method falling between spatial interpolations and a conceptual model is the Top-Kriging (TOP) method. TOP is based on geostatistical methods originally developed for the needs of the mining industry [7]. By expanding and transforming them, a geostatistical interpolation method was created which enables the estimation of various hydrological parameters in ungauged catchments. TOP combines two main groups of processes: 1) creation of runoff within the catchment and 2) aggregation and routing of runoff within the river network. To this end, runoff generation is conceptualized as a spatially continuous process that exists at any point in the landscape. Runoff aggregation is then described as a cumulatively increasing value that increases with distance from the source. The basis of the method is the kriging interpolation method (also known as the Best Linear Unbiased Estimator), which is modified to respect the hierarchy within the hydrological network. The method uses a variogram to estimate hydrological variables. Thanks to this, it is also able to process non-stationary variables. The method considers local measurement uncertainties, which may vary in different locations, and thus is able to use even short measurement records. It also enables the estimation of uncertainty in the determination of the measured variable [8].
It is assumed that the performance of the method increases with the increasing density of the river network, the increasing size of the catchment areas, and depends on the number of gauged catchments [9]. Compared to the Ordinary Kriging method, it provides better results especially when describing nested catchments on neighbouring river branches [8]. However, it is typical for both methods that they overestimate the results in the lower sections of the watercourses (closer to the closing profile of the gauged catchments) and, simultaneously, underestimate the results in their more distant parts [10, 11]. The method achieves good results in the case of large homogeneous catchments [12]. However, the question remains how the algorithm will be able to describe the variability of runoff within smaller non-homogeneous catchments.
In addition to estimating runoff sizes, TOP has also been applied, for example, to calculate runoff curves [13], estimate water discharge velocity [14], determine the time series of runoff from a catchment [10], estimate the height of flood probability quantiles, and the suitability of a watercourse as an ecological habitat [15, 16].
The aim of this article is to evaluate the applicability of the TOP method for the estimation of runoff from fourth-order catchments in the Czech Republic.
MATERIALS AND METHODS
Pilot site
The pilot site is the Otava river basin. The Otava is formed by the confluence of the Vydra and Křemelná near Čeňkova Pila in Šumava; the basin covers an area of 3,788.0 km² and the length of the river is 113 km. In its upper part (above the town of Sušice, 91.7 river km) it is characterized by a steep river bed and high water content. This gives it the character of an upland watercourse. In this section, it flows mainly through wooded valleys; from Sušice towards the mouth, it mainly flows through cultural agricultural landscape. Its character changes to a meandering lowland watercourse with signs of sedimentation [17]. The upper parts of watercourses in the Otava basin show a low degree of anthropogenic transformation (e.g. in the source area of Vydra, Hamerský potok, Otava, Volyňka, and Spůlka). In contrast, the rate of anthropogenic transformation of the hydrographic network is increasing in the middle and lower sections. This increase is related to the increase in socio-economic use of valley floodplains [18]. The lower part of the river is permanently flooded; the length of this depends on the current height of the water level of Orlík hydraulic structure (HS). Under normal conditions, this is about the last 19 km (18.6 river km to Sulan weir). The highest point in the Otava basin is Luzný (1,373 m above sea level), the lowest point where the river reaches Orlík HS. The most important tributaries are the rivers Blanice, Volyňka, Lomnice, Ostružná, Křemelná, and Vydra. The location of the Otava basin within the Czech Republic is shown in Fig. 1.
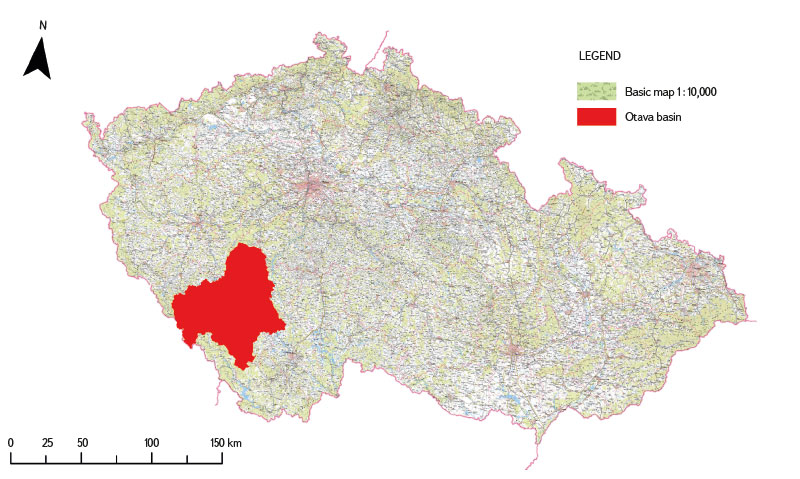
Fig. 1. Location of the Otava basin within the Czech Republic
Top-Kriging
TOP calculates a point variogram based on the measured data (discharge measured in the gauged catchments in m3/s). It is used to describe the degree of spatial dependence on a spatial random variable (specific runoff) within the modelled territorial unit. However, this point variogram cannot be used directly to estimate runoff for individual catchments due to the different sizes of the sub-catchment areas. For this reason, different groups of theoretical variograms for individual size classes of sub-catchments are tested in TOP, for which the most suitable variogram model is then automatically selected. After the variograms for individual classes are determined, the prediction of the specific runoff for individual forecast catchments will occur [8].
The inputs for TOP are the axes of the watercourses in the study area, the delineated gauged catchments, and the delineated forecast catchments. Gauged catchments are larger territorial units (catchments) within the overall described area (Otava basin), for which selected hydrological characteristics are known. The magnitude of the given characteristic is interpolated by the TOP method into the forecast catchments that fall into the gauged catchment (they are their sub-catchments).
Watercourse axes in the Otava basin
The current axes of watercourses for the entire Otava basin were taken from the DIBAVOD system (Digital water management database) in ESRI digital vector format (*.shp). Specifically, it was layer A03 – watercourse (rough sections) [19].
Forecast catchment
This is a catchment for which the TOP method is to be used to predict selected hydrological parameters (runoff). For the needs of this article, the fourth-order catchments were chosen as the forecast catchment, which was also taken from the DIBAVOD system. In this case, it was layer A08 – hydrological division – fourth-order catchment [19].
Gauged catchments
For the TOP needs, the catchments to the existing limnigraphic stations in the Otava basin were chosen as the gauged catchments. These catchments were created by grouping fourth-order catchments according to their affiliation to the given limnigraphic station. The fourth-order catchment in which this station was located became the closing catchment for the newly grouped catchment. If there were several limnigraphic stations on a watercourse (e.g. Otava), only the catchments located between the individual limnigraphic stations were assigned to the lower stations. The reason for determining the gauged catchments based on the distribution of limnigraphic stations was the availability of hydrological data for these stations. The distribution of gauged catchments within the Otava basin is shown in Fig. 2.
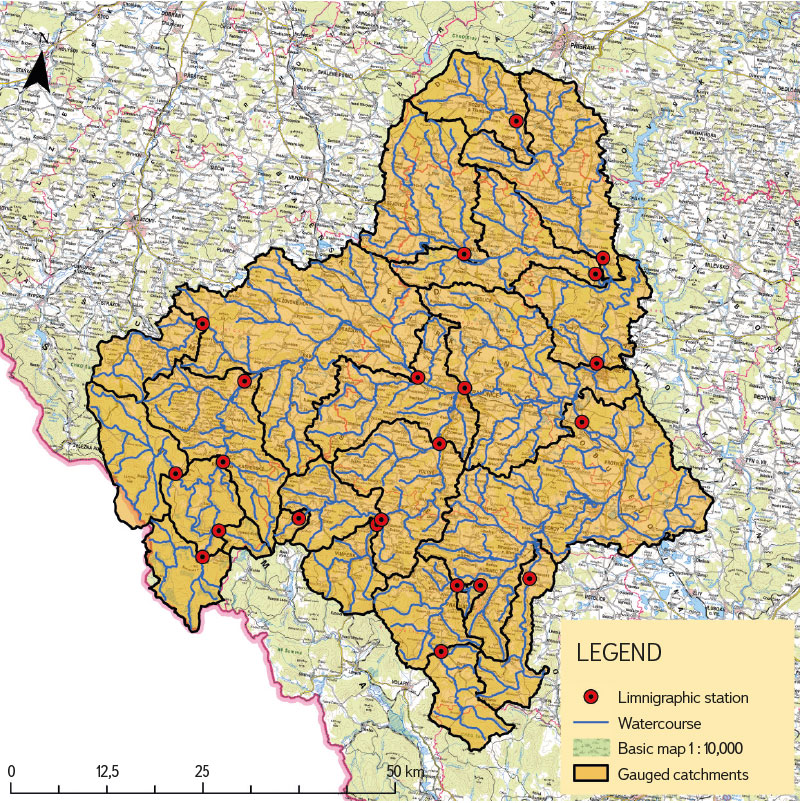
Fig. 2. Location of gauged catchments within the Otava basin
Hydrological data for the gauged catchments
Hydrological data for limnigraphic stations are freely available thanks to the “Reporting Profile Record Sheets”, which can be found, for example, through the “Flood Forecasting Service” (HPPS). The HPPS is operated by the CHMI [20]. As part of this study, data were used from the Reporting Profile Record Sheets Nos. 112–120, 121a, 122–124, 126–131, and the Record Sheets of the operative profiles of Antýgl, Strakonice, and Nový Dvůr. In total, there were 22 limnigraphic stations from which discharge Q1, Q10, and Q100 were taken. Discharge Q355d and Qa were then added for the same stations, which are available through the ISVS portal – Records of the amount of surface water [21].
Map of mean precipitation totals
It is published by CHMI. The map is part of a group of maps describing climate characteristics in the Czech Republic. Specifically, it shows mean annual rainfall (mm) for 1991–2020. The map is issued in the form of a raster [22].
Map of long-term mean base runoff
It is published by the Czech Geological Survey. The map is available through the Web Map Service (WMS). It expresses the mean values of the long-term mean base runoff (l/s/km2) for 1991–2020 [23].
Reference runoff data
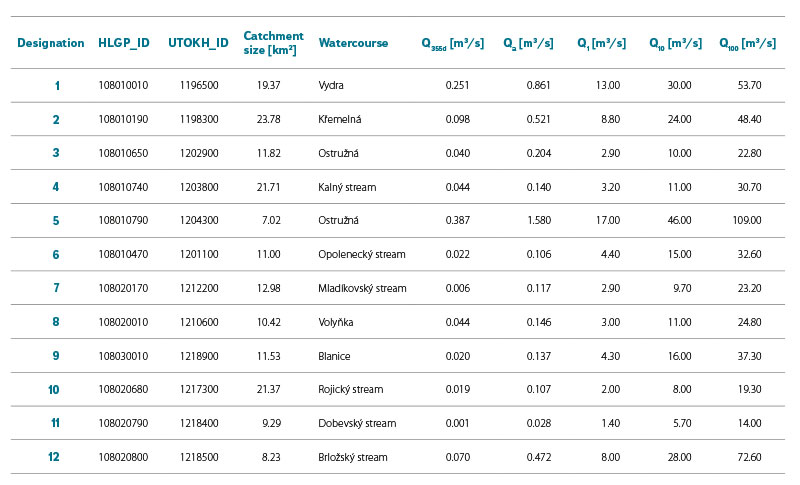
Reference data for the needs of this study were purchased from CHMI in the form of basic hydrological data (according to ČSN 75 1400) for selected fourth-order catchments. According to the classification of basic hydrological data of surface waters, all reference data fell into class III. M-day discharge were derived for the reference period 1981–2010 and N-year discharge for the maximum available observation period. In total, data were purchased for 12 fourth-order catchments. A more detailed specification of the reference catchments is given in Tab. 1 and their distribution within the Otava basin in Fig. 3.
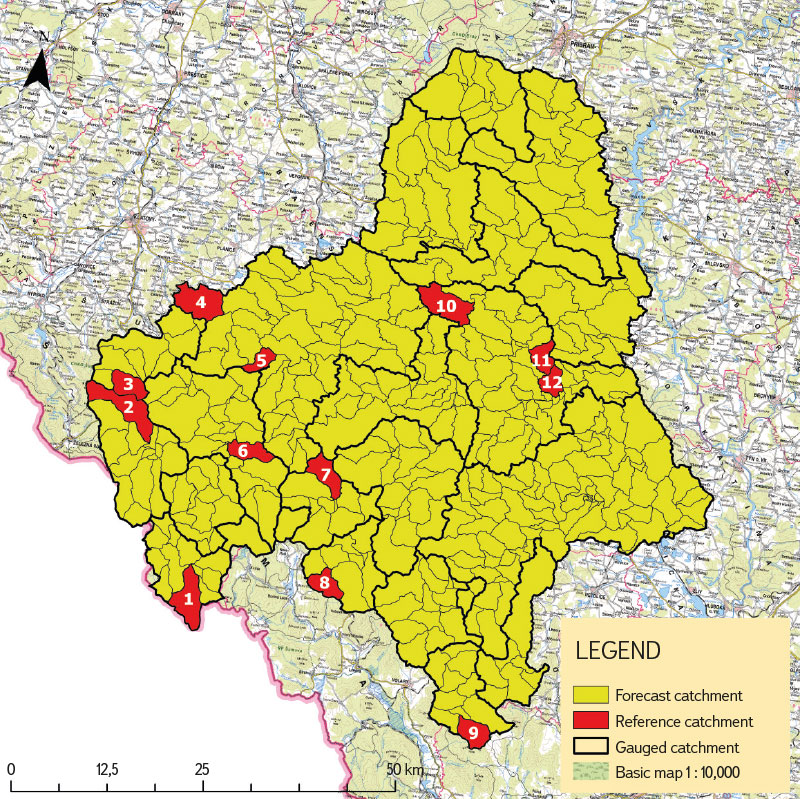
Fig. 3. Location of reference catchments within the Otava basin
Tab. 1. Specification of reference fourth-order catchments
All data used in this study are in the S-JTSK / Krovak East North coordinate system (EPSG 5514) and the Baltic height system after levelling (EPSG 5705).
METHODOLOGY
Several methods were chosen for runoff prediction. The basic method was the Top-Kriging (TOP) method. Other methods were the transformation of TOP results based on data on the mean annual precipitation total (TOP_Hs) and long-term mean base runoff (TOP_ZO). The other two methods used a direct runoff calculation, which was based on the values of the mean annual precipitation total (R_Hs) and the long-term mean base runoff (R_ZO). The prediction was made for a range of discharge rates (Q355d, Qa, Q1, Q10 a Q100). All calculations and subsequent evaluation of the results were processed in the R software environment [24].
Top-Kriging
Specific runoff (l/s/km2) were predicted for all fourth-order catchments in the Otava basin, which were subsequently converted (through the area of the given catchment) to runoff from the catchments (m3/s). To determine the prediction in the R environment, the rtop extension [25] was used, through which the TOP method is available. The required inputs were the gauged catchments, watercourse axes, and the catchments for which the prediction was to be determined (in our case, fourth-order catchment).
Transformation of Top-Kriging results
For the TOP values, their transformation was continued based on the value of the mean annual precipitation total (Hs) and the long-term mean base runoff in the given catchment (ZO). The purpose of the transformation was to redistribute the original values within the gauged catchment based on the selected weights (Hs, ZO). Mean values of Hs and ZO were determined for each gauged catchment and its forecast catchment (fourth-order catchment, which together form the given gauged catchment). If the Hs (ZO) value of the forecast catchment was higher than the value of a given gauged catchment, its TOP value was increased. Otherwise, it was decreased. The rate of increase (decrease) in redistribution values was controlled by the size ratio of Hs (ZO) between the gauged and forecast catchment.
Direct runoff calculation
A direct discharge calculation was also implemented within the gauged catchments. This calculation was based on a weighted average over the areas of forecast catchments, where Hs (R_Hs) or ZO (R_ZO) values were chosen as weights.
Assessment of prediction quality
Conformity assessment was performed for all monitored discharge rates and all reference catchments (12 catchments). Mean Absolute Error (MAE) and Root Mean Square Error (RMSE) were used as evaluation metrics.
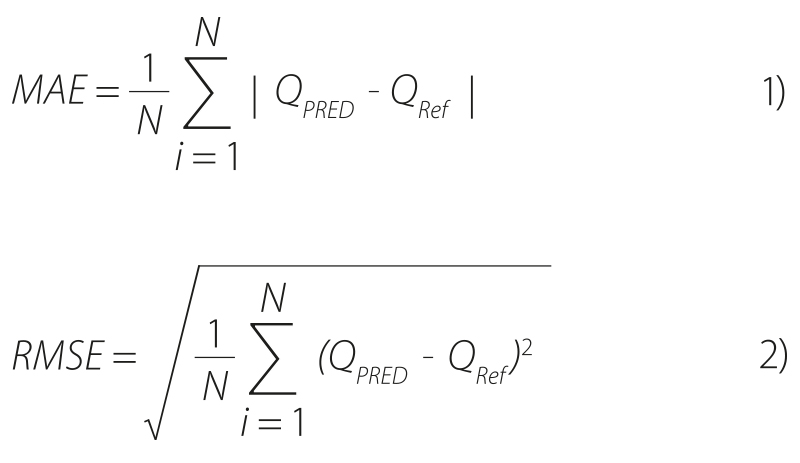
where:
QPred is the discharge value for fourth-order catchment (corresponding to the given reference catchment) determined by calculation methods (TOP, TOP_Hs, TOP_ZO, R_Hs, R_ZO)
QRef discharge reference value for the given catchment
N number of reference catchment
RESULTS
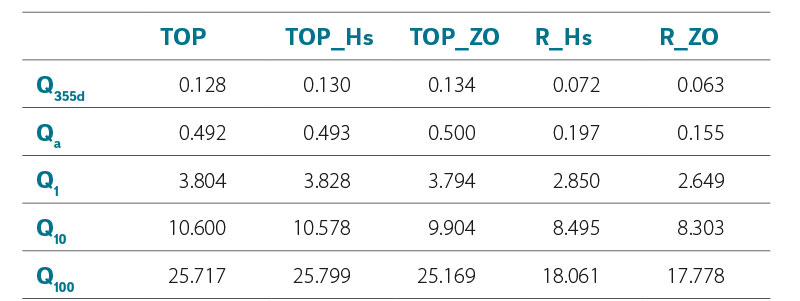
The results show that the smallest mean errors were achieved by the R_ZO method for all evaluated discharge rates. The lowest error was for discharge rate Q355d (0.063 m3/s), the highest error was for discharge rate Q100 (17.778 m3/s). The second best results were achieved by the R_Hs method. The TOP, TOP_Hs, and TOP_ZO methods produced mutually comparable, but worse results than the R_ZO and R_Hs methods. This was especially true for the results at low discharge rates (Q355d and Qa), where they reached several times higher error values. For discharge rate Q100, the value of their errors was around 25.5 m3/s. The least significant difference was in the Q10 discharge rate. A summary of the determined MAE values is given in Tab. 2.
Tab. 2. Summary of achieved MAE values (m3/s)
The best RMSE results were again achieved by the R_ZO method at discharge rate Q355d (0.123 m3/s). The TOP, TOP_Hs, and TOP_ZO methods produce the highest RMSE values at all discharge rates, with minimal differences between them. Their values are in most cases almost double compared to R_ZO. The individual values follow the trends of the error distribution depending on the predicted runoff similar to the MAE values. The RMSE values for the Q355d and Qa discharge rates are almost double the corresponding MAE values, which indicates the occurrence of significant error values for some catchments within the datasets of all methods. In contrast, the R_ZO and R_Hs methods show only small differences between RMSE and MAE for discharge rate Q100. This indicates that the error sizes for individual catchments within the data set did not reach significant values. The summary of the determined RMSE values is given in Tab. 3.
Tab. 3. Summary of achieved RMSE values (m3/s)
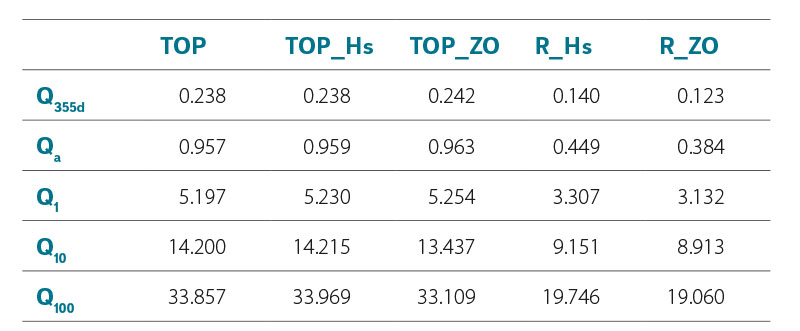
Fig. 4 shows the variability of errors for individual prediction methods and studied discharge rates. It is clear that the variance of the absolute error at discharge rate Q355d is significantly lower for the R_ZO and R_Hs methods than for TOP, TOP_Hs, and TOP_ZO. This trend can be observed for all forecast discharge rates. The distance of the position of the medians from the averages (especially for discharge Q355d and Qa) points again to the presence of significant values in the error files of the TOP, TOP_Hs, and TOP_ZO methods. In the case of discharge Q10 a Q100, these significant errors were associated with the quality of prediction in catchments No. 7, 11 and 12.
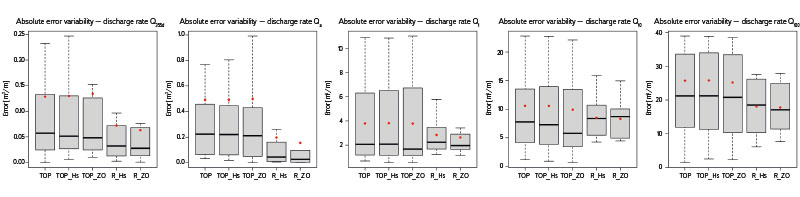
Fig. 4. Graphic representation of the variability of the errors achieved by the compared methods for individual evaluated discharge rates
DISCUSSION
TOP is also often compared with regional regression models. It turns out that when modelling low discharge rates, which are primarily controlled by subsurface processes, its results are comparable to regression models – while requiring a minimal amount of input data compared to regression models [3].
The goal of transforming the original TOP results using Hs and ZO was to improve the performance of the TOP method. The method itself does not work with additional inputs. It uses only the spatial dependence of the given variable defined by the variogram. The most appropriate approach would be to directly implement Hs or ZO into the TOP algorithm. However, this exceeds the objectives of this study.
The transformation of the original TOP values always took place within the gauged catchments. This step ensured that the resulting discharge rate value was not altered after redistribution. The possibility of redistribution within the entire Otava basin was also investigated. This variant led to non-compliance with the discharge rates in the individual gauged catchments. The reason for conducting the redistribution separately was the effort to find out which of the variables (Hs, ZO) will have a greater influence on the results. The question remains whether the choice of a more appropriate transformation mechanism would not bring a more significant increase in performance than that described in this article.
The direct discharge rate calculation based on Hs or ZO was used for comparison (as a basic method) with the TOP method and its derivatives. However, it proved to provide better performance than TOP and its derivatives. The poor performance of TOP may be related to the high heterogeneity and small size of the forecast catchments, which TOP is unable to capture and describe [12].
The gauged catchments were drawn based on the grouping of fourth-order catchments. The fact is that some limnigraphic stations are not within the fourth-order catchments placed directly into their closing profiles. They therefore have a slightly larger area than the given limnigraphic station (or the area of the inter-catchment between two limnigraphic stations on the same watercourse). We assume that this aspect affects only the exact value of the discharge rate that is calculated, but not the methodological procedure of this calculation.
The reference data in this study were only available for a small part of the fourth-order catchment. The reason is the price of this data. The authors are aware that such a small reference set may affect the uncertainty of the results. Another source of uncertainty can be the reference data values themselves. These belong to class III basic hydrological data of surface waters. The relative value of the root mean square error for data from this class can take values from 20 (Qa) to 40 (Q100) % [26].
The selected range of investigated discharge rates aimed to show what results the TOP method will achieve in different discharge scenarios. As expected, larger absolute errors were achieved at high discharge rates.
This paper is part of TA CR project TK04030223 and as such follows its goals. One of them is to estimate the outflow of Qa from the fourth-order catchments in the Czech Republic. For this purpose, it is necessary to use the available datasets covering the entire Czech Republic, process and evaluate them appropriately. This paper can therefore be seen as a pilot part of the entire project.
CONCLUSION
In this paper, an evaluation of the performance of the Top-Kriging method and its derivatives in determining runoff from ungauged fourth-order catchments in the Otava basin was performed. The study results show that the R_ZO method achieved the best performance in determining runoff from ungauged catchments, regardless of the size of the predicted discharge rate. It was followed by the R_Hs method. The TOP method shows in some cases the production of significant differences between predicted and reference data. These differences were detected especially in reference catchments No. 7, 11 and 12. The question remains as to what makes these catchments unique. This phenomenon appears regardless of the predicted runoff size and is further prescribed in the performance of the TOP_Hs and TOP_ZO models. The study also tried to improve the performance of the Top-Kriging method itself in post-processing. The behaviour of the original algorithm was shown to be stronger than the additional adjustment of the results, resulting from considering the distribution of the mean annual precipitation total or the long-term mean base runoff. This resulted in only a slight performance improvement for the TOP_Hs and TOP_ZO methods.
Acknowledgements
This paper was created with the support of the Technology Agency of the Czech Republic as part of project No. TK04030223 “Determining the hydropower potential of Pico-Hydropower in current and predicted climatic conditions of the Czech Republic”.
The Czech version of this article was peer-reviewed, the English version was translated from the Czech original by Environmental Translation Ltd.
