ABSTRACT
Grey water footprint refers to the amount of water required to dilute pollutants released into the aquatic environment so that the water quality remains above agreed water quality standards. This study examines the grey water footprint of micropollutants, also referred to as contaminants of emerging concern (CECs), compared to commonly monitored water parameters (such as nutrients and organic pollution) in wastewater. 24-hour samples were analysed from Indonesia’s largest WWTP, which uses a stabilization pond system for wastewater treatment. The grey water footprint was calculated for 12 micropollutants and six parameters of standard chemical monitoring. The highest value of the grey water footprint in the WWTP effluent was for BOD5 (13.5 l/l). The highest value among the micropollutants in the WWTP effluent was for Fluoxetine (0.08 l/l). When using other published PNEC values, Fluoxetine reached higher grey water footprint values than BOD5. The highest value of the grey water footprint in the WWTP influent was for Ibuprofen (210.4 l/l), but this substance was effectively removed in the WWTP.
INTRODUCTION
Since its introduction in 2002 [1], water footprint has become a popular tool for assessing water use by human society. In general terms, the water footprint of an assessed product system represents both direct and indirect consumption of water for creation of a product, service or process throughout its life cycle [2]. Water footprint consists of three components denoted by “colours”. The blue water footprint represents the amount of water withdrawn from water sources and consumed during the life cycle of the product system under consideration. The green water footprint represents the amount of precipitation (e.g. in the form of soil water) consumed during the life cycle of the product system under consideration. It is usually significant in agro-systems and food products. And finally, there is the grey water footprint, which represents the amount of water needed to dilute the life-cycle pollution discharges from the product system under consideration.
Wastewater production is intrinsically linked to both human settlements and industrial production. To ensure environmental water quality standards, individual countries adopt legislation that regulates wastewater discharge. This legislation usually prescribes such limits that trigger the need to build WWTPs. In the past, the calculation of the grey water footprint of wastewater was the subject of a number of studies focused on, for example, the efficiency of WWTPs [3] or the comparison of different WWTP systems [4]. These studies usually focus on assessing “common” pollution as expressed by parameters of biochemical oxygen demand (BOD5), chemical oxygen demand (COD), total phosphorus (TP), and total nitrogen (TN). Various studies then add other substances, such as nitrate nitrogen [5] and total oxygen [6].
In recent years, the issue of so-called micropollutants has begun to be discussed in the professional community [7]; these are substances usually of anthropogenic origin, which occur in the environment in very low concentrations and which we are only able to detect with the advent of new detection techniques such as LC-MS/MS. However, their behaviour in the environment has not yet been sufficiently investigated, and therefore there is a risk of adverse effects of these substances on the environment and ecosystems, even at very low concentrations. These substances are sometimes referred to as ‘emergent’ (in the sense of ‘new’) pollutants or substances/contaminants/pollutants of emerging concern (CECs). Typical representatives of these substances are pharmaceuticals, industrial and agricultural chemicals, personal care substances, etc. [8]. Several studies of the grey water footprint of pollution discharged from WWTPs have also been devoted to micropollutants. So far, these studies are relatively few as scientists have so far mainly focused on describing the occurrence and behaviour of these pollutants in the environment [9, 10].
Probably the first study to quantify the grey water footprint of micropollutants is a Spanish study of 12 WWTPs [11]. This study more or less defined the procedure to assess micropollutants through the grey water footprint. However, it also pointed to the possibility that micropollutants may have a higher grey water footprint than the commonly monitored pollution. This finding has not yet been confirmed by any other study, but neither has any other study shown that the finding is more of an exception. One of the reasons is the fact that in wastewater, common pollutants and micropollutants are usually not monitored simultaneously. As far as we know, the only other study comparing the grey water footprint of common pollutants and micropollutants is the study of the Dolní Kralovice WWTP in the Švihov reservoir basin [12], where, however, the grey water footprint of common pollutants significantly exceeded the values of the grey water footprint of micropollutants. The goal of our study is to expand the so far very sparse literature dealing with the comparison of the grey water footprint of common pollutants and micropollutants.
DATA AND METHODS
WWTP of interest
The Bandung central WWTP is located in Bojongsoang (Fig. 1) and has an effective capacity of 40,000 m3 per day [13]. It is the largest WWTP in Indonesia. Treated wastewater is discharged into the Citarum River, the largest river in West Java province and also one of the most polluted rivers in Southeast Asia [14]. The treatment process at the WWTP is two-stage. The first stage consists of physical/mechanical processes involving screens, sieves, and primary sedimentation. The second stage uses a system of stabilization tanks consisting of anaerobic, oxidation, and sedimentation tanks, in which biological wastewater treatment processes take place. Anaerobic and oxidation tanks are designed to reduce the biochemical oxygen demand (BOD5), while secondary settling tanks are mainly used for tertiary treatment [15]. A diagram of Bandung WWTP is shown in Fig. 2.
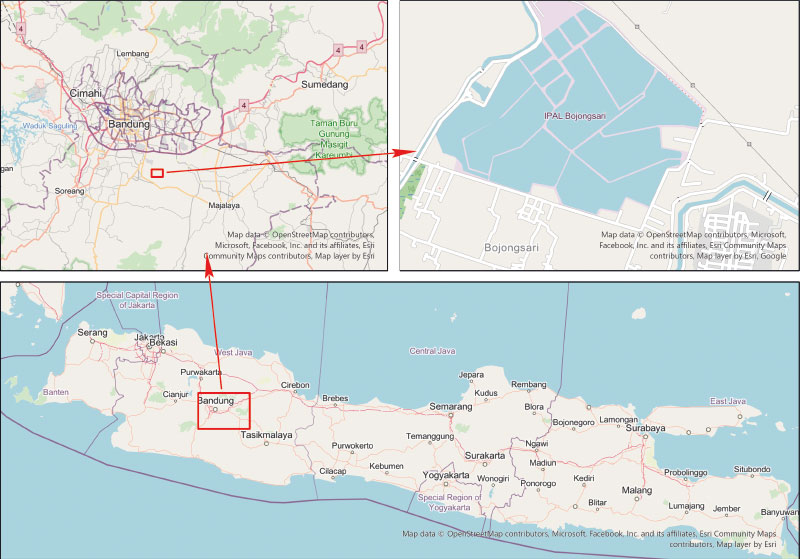
Fig. 1. Bandung WWTP
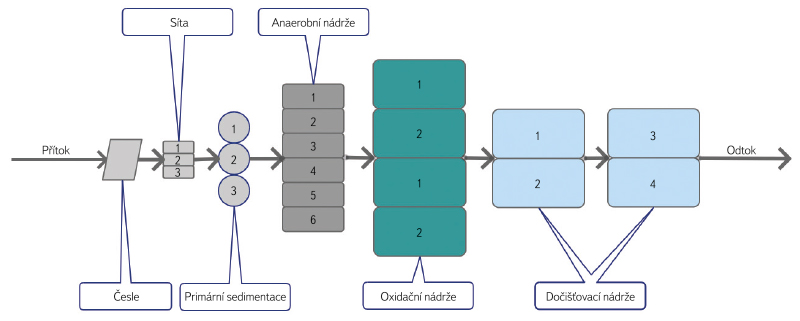
Fig. 2. Diagram of Bandung WWTP
Data published in an article on sample collection and processing at Bandung WWTP [16] were used for this study. The 24-hour composite samples analysed in the study were collected hourly using vertical samplers in Van Dorn bottles between 7:00 a.m. on 18th June 2019 and 6:00 a.m. on 19th June 2019. For the grey water footprint study, water quality data were used at the WWTP influent and at the WWTP effluent.
Grey water footprint calculation
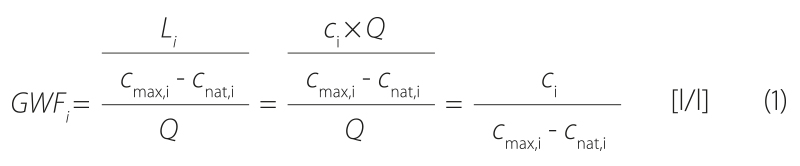
The grey water footprint of a unit volume of wastewater is calculated for each pollutant using Equation 1:
For micropollutants, the equation is modified in accordance with the procedure described by Martínez-Alcalá [11]:
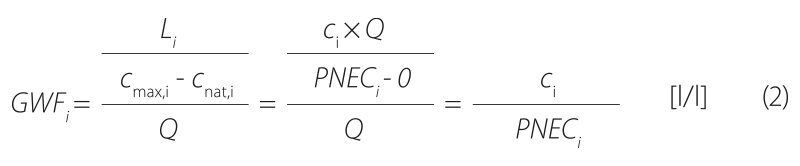
where:
GWFi is the grey water footprint of substance i
Li amount of discharged pollution i
cmax,i the maximum allowed concentration of substance i in the aquatic environment (environmental standard)
cnat,i natural background concentration of substance i in the aquatic environment; for anthropogenic substances = 0
ci concentration of substance i in wastewater
Q flow rate of discharged wastewater; considering the objectives of the study, a value of Q = 1 was considered
PNECi concentration of substance i below which no adverse effect of exposure in the ecosystem is expected
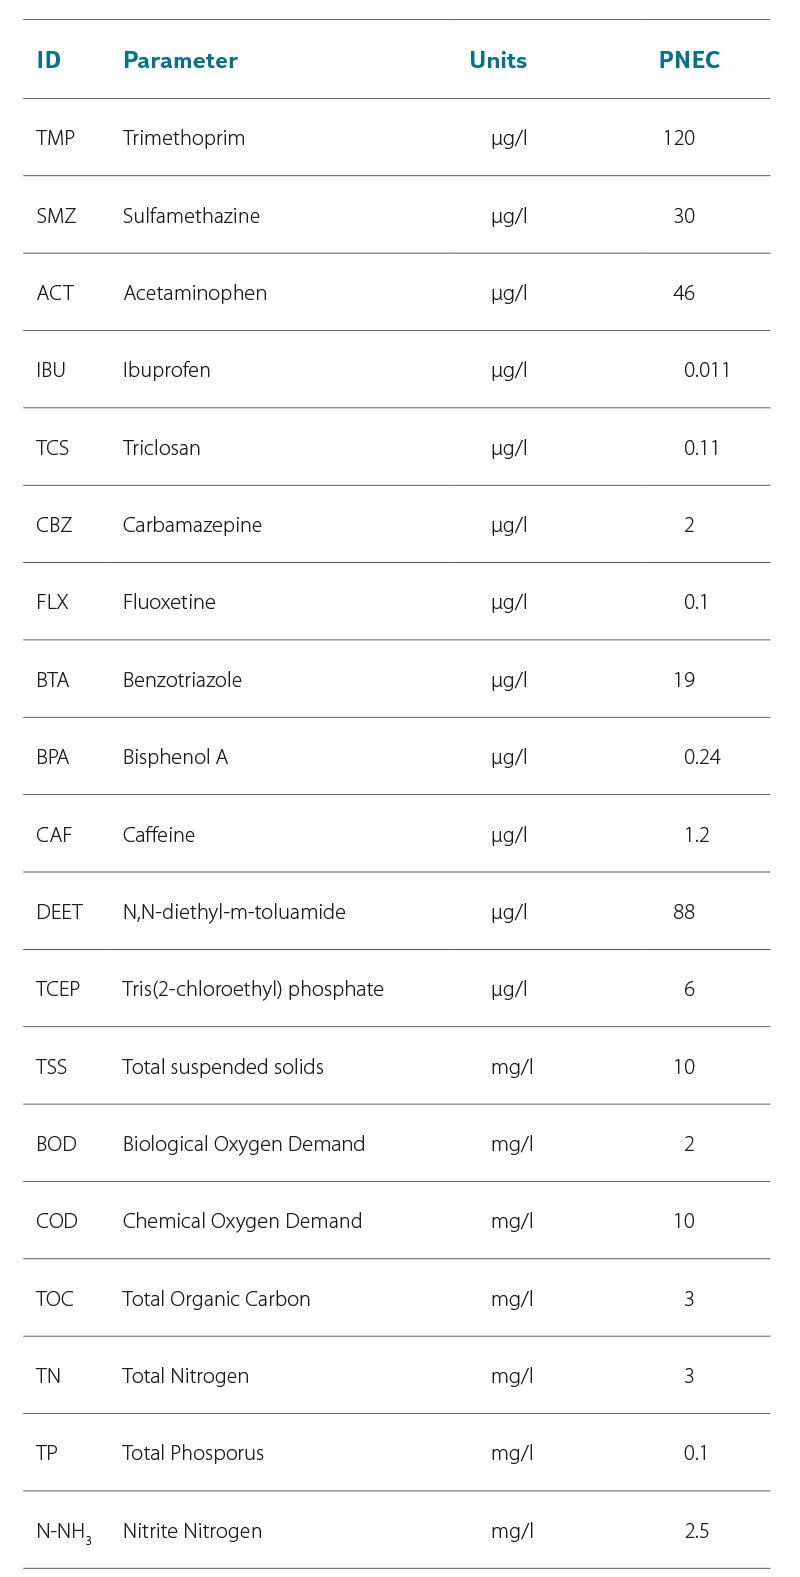
The predicted no-effect concentration values were taken from the NORMAN database [17]. The values for cmax and cnat used for the calculation according to Equation 1 and the PNEC values for the calculation according to Equation 2 are given in Tab. 1.
Tab. 1. Values of cmax, cnat and PNEC used in analysis
The grey water footprint of the WWTP is determined by the substance with the highest value:

where:
GWF is the grey water footprint of the WWTP
GWFi grey water footprint of the substance i at the WWTP
RESULTS AND DISCUSSION
Tab. 2 shows the summary results. The BOD5 parameter has the highest value of the grey water footprint of common pollutants at the influent to the WWTP and the effluent from the WWTP, for which the GWF value decreased from 45 l/l to 13.5 l/l (influent → effluent). Thus, the findings of previous studies [5, 11], that the grey water footprint on the effluent from the WWTP is usually determined by total phosphorus, were not confirmed. It is probable that this phenomenon is typical for WWTPs based on a stabilization tank system, whereas previous studies have investigated mechanical-biological WWTPs with activation. BOD5 has the overall highest value of the grey water footprint in the effluent of all monitored substances (Fig. 3).
Tab. 2. Concentrations and Grey Water Footprint of conventional pollution and micropollutants
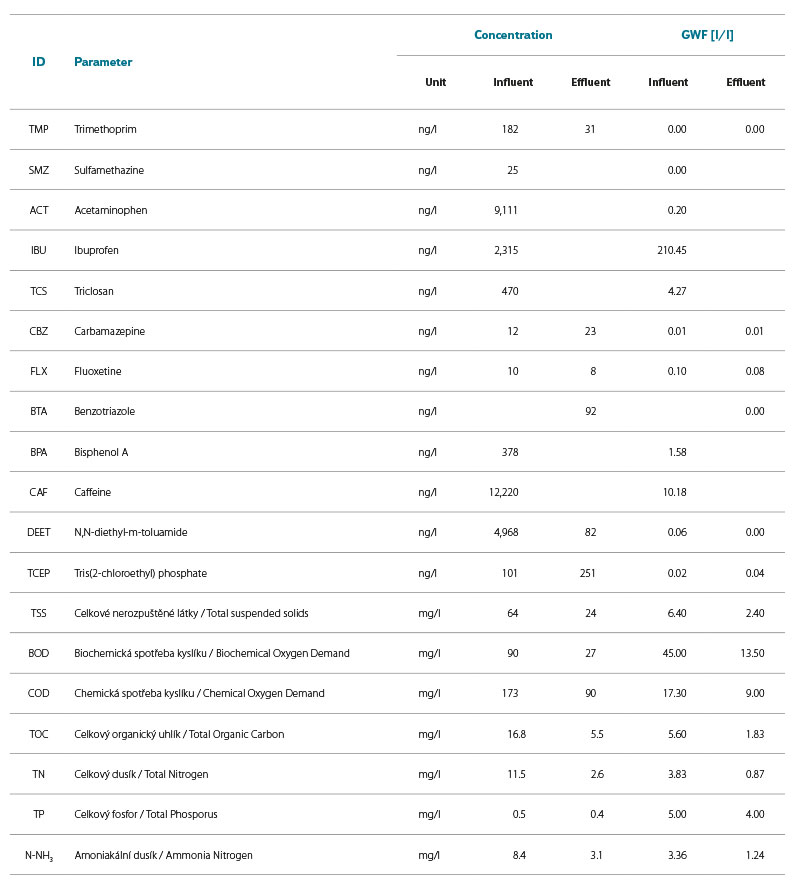
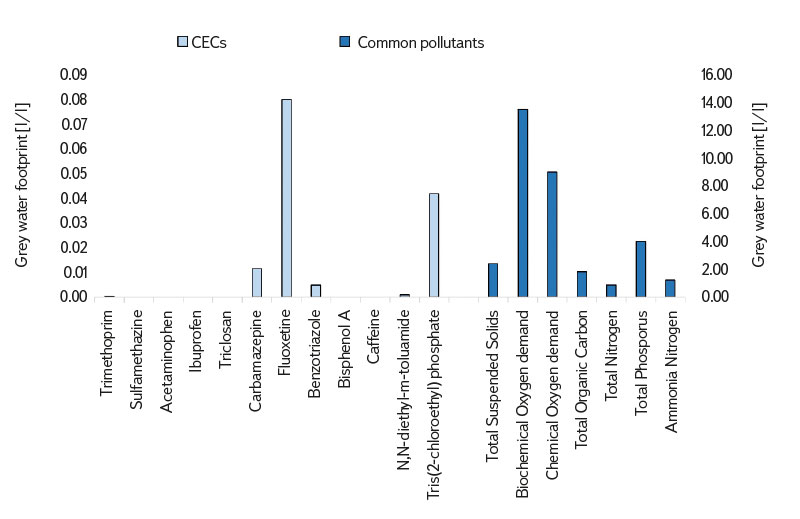
Fig. 3. Grey water footprint – Bandung WWTP effluent
Of the monitored micropollutants, the antidepressant Fluoxetine (0.08 l/l) had the highest value in the effluent. The overall value of its grey water footprint is mainly due to the low PNEC value of 100 ng/l. In recent literature, significantly stricter values can also be found, e.g. 0.0291 ng/l [18] from 2022, or 3 ng/l [19] and 10.8 ng/l [20] from 2019. For the PNEC of 0.0291 ng/l, the grey water footprint value of Fluoxetine would reach 274.9 l/l, which is 20 times higher than the grey water footprint value of common pollutants. It can be confirmed that the value of the grey water footprint is extremely sensitive to the choice/selection of the PNEC value, or cmax. The finding of Martínez-Alcalá [11] that micropollutants can be a determinant of the overall grey water footprint of pollution discharged from WWTPs cannot yet be unequivocally confirmed. Only further research into the toxicity of micropollutants will show whether these substances, despite their minimal concentrations in wastewater, are decisive for the water footprint. Using the PNECs published in the NORMAN database instead of using other values can be recommended for three main reasons:
- These are values discussed by experts associated with NORMAN.
- Values are periodically revised/updated.
- Values are available for most of the known micropollutants.
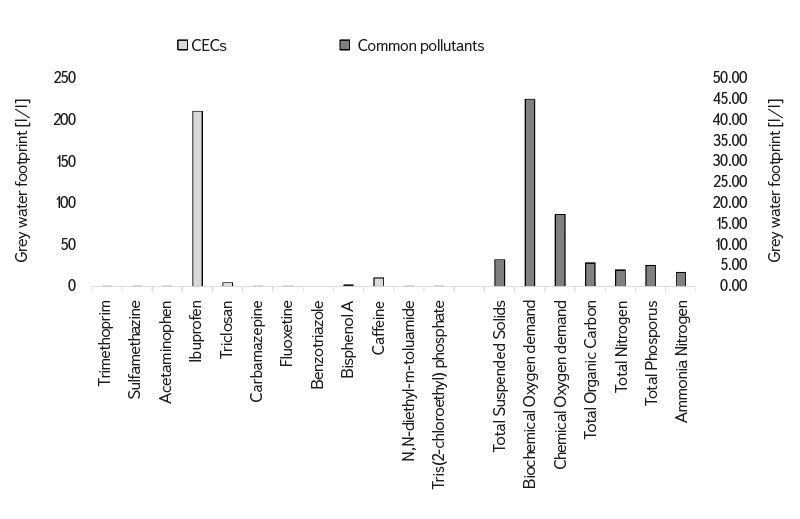
Fig. 4. Grey water footprint – Bandung WWTP influent
A slightly different situation occurs with untreated wastewater at the influent to the WWTP (Fig. 4). Ibuprofen has the absolute highest grey water footprint (210.5 l/l), which is due to the high concentration of this substance at the influent to the WWTP and especially the extremely low PNEC value of 11 ng/l. However, similarly low PNEC values are also reported by other authors [19, 21]. Other authors also confirm high concentrations of Ibuprofen in municipal wastewater [22]. Ibuprofen is usually very well degraded by the stabilization tank system, so this substance was not detected in the WWTP effluent. Other studies also confirm the effective removal of Ibuprofen at the WWTP [23]. The total reduction of the grey water footprint at the WWTP thus reached 93.59 %. Such a reduction value has not yet been recorded in any study dealing with grey water footprint reduction at WWTPs.
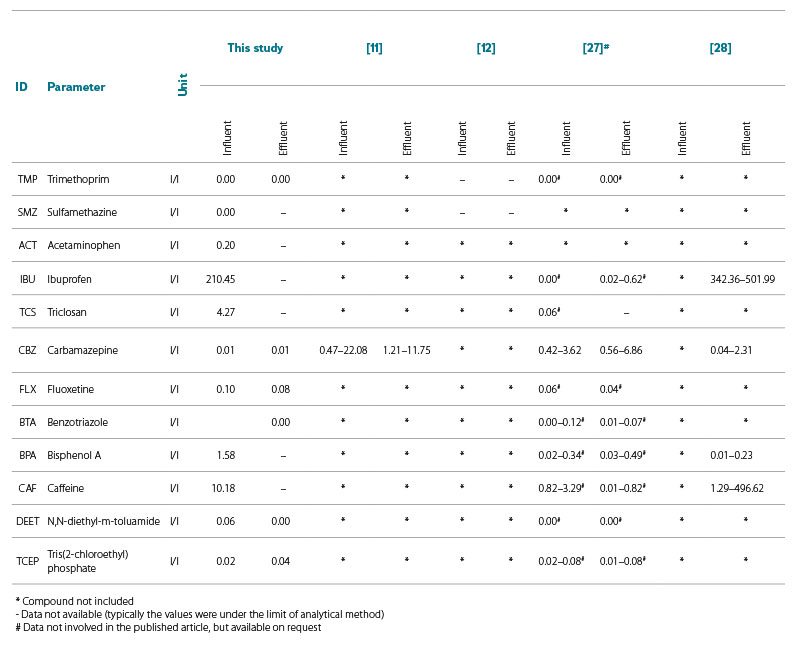
Tab. 3 shows a comparison of the grey water footprint of micropollutants from different studies. It shows that the studies to date differ greatly in the range of monitored micropollutants and in the values of their grey water footprint. There could be a number of reasons for this. This may be due to a) the different PNEC value used to calculate grey water footprint, b) the high variability of the presence of micropollutants in wastewater, and c) the different analytical methods used to determine micropollutants in wastewater. This can be demonstrated by two studies from European WWTPs [24, 25], where one set of samples was analysed by two different methods and different results are available for three substances that were analysed by both methods.
Tab. 3. Comparison of values presented in studies of GWF of micropollutants at WWTPs
Several limitations of the study should be considered when interpreting the results. First, it is a study based on one-day samples, which may not show the temporal variability of the wastewater composition. Second, it should be taken into account that this is a study of a WWTP using a system of stabilization tanks, which is not widespread in, for example, central European conditions due to high requirements for area and lower treatment efficiency. Third, a WWTP in Indonesia is included in the study, where there are different climatic conditions that affect the biological processes of wastewater treatment. Last but not least, it should be noted that a number of micropollutants, such as pharmaceuticals, are biologically active substances that have the ability to affect non-target organisms. Wastewater contains a varied mixture of these substances, in which individual micropollutants can mutually react and metabolize. However, the grey water footprint principle is based on the idea of assessing individual pollutants, and for micropollutants it would be more appropriate to consider mixtures [24, 26].
CONCLUSION
The conducted study complements the so far very sparse literature comparing the grey water footprint of standard monitored chemical parameters with micropollutants discharged from WWTPs. The study confirmed that the choice of PNEC value is crucial for whether micropollutants can be a determinant of the value of the total grey water footprint of discharged municipal pollution. Using the PNEC values available in the NORMAN database, the grey water footprint value of treated wastewater was determined by common pollutants. Conversely, in untreated wastewater, micropollutants would be dominant. Using the PNEC values that have been published in recent years, micropollutants would already be a determining pollutant even in the effluent from the WWTP. Further research on the ecotoxicity of micropollutants is thus essential for the assessment of grey water footprint in practice.
Acknowledgements
The authors would like to thank Dr. Maryana P. Astuty and doc. Lokesh Padhye of the University of Auckland, New Zealand for providing the data. They also want to thank Dr. Hana Nováková from TGM WRI for the preparation of Fig. 1.
Conflict of interest
The authors declare no conflict of interest.
The Czech version of this article was peer-reviewed, the English version was translated from the Czech original by Environmental Translation Ltd.
