SUMMARY
This paper deals with the development of water quality in the Elbe in the section between its confluence with the Vltava and the Hřensko border profile in 1980–2020, and with the influence of Prague on its pollution levels. After a significant improvement in 1985–2000, the quality of water discharged through the Hřensko profile today is at least at the level of the Federal Republic of Germany. Evaluation of substance transport shows that the Vltava contributes a larger share of pollution to the Elbe simply because it has higher flows. Prague contributes to pollution of the Vltava and the Elbe by discharging phosphorus.
As for other long-term indicators, it is an insignificant source.
In 2010–2020, there is a significant level of concentrations of pharmaceuticals, which come exclusively from the discharge of municipal wastewater treatment plants (WWTP). Many pharmaceuticals regularly occur in concentrations of tens to hundreds of [ng/l], and resistant pharmaceuticals (gabapentin, metformin, oxipurinol, carbamazepine) are transported to Prague from the Vltava basin through the Orlík and Slapy reservoirs with a high theoretical retention time. The transport of resistant pharmaceuticals through relevant profiles corresponds mainly to the number of inhabitants in their river basins because they obviously pass through WWTP and do not degrade further in the river either.
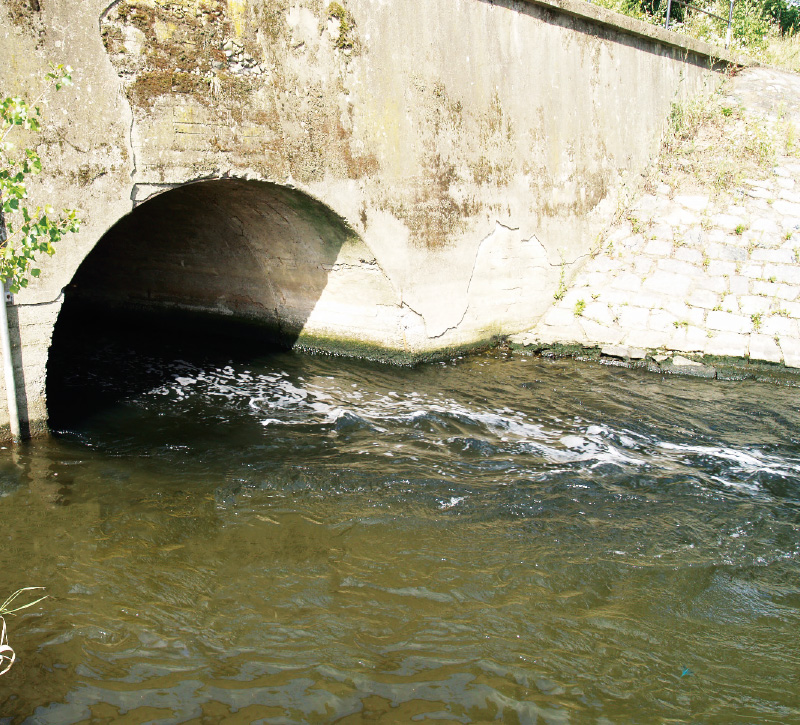
The main source of pollution in the Vltava is the Central Wastewater Treatment Plant in Prague (see text). Here is its original outlet, today it is strengthened by a new water line.
(Photo: J. K. Fuksa)
INTRODUCTION
Prague is potentially the largest source of pollution of the Vltava and, after the confluence, the Czech section of the Elbe. We therefore tried to assess this source objectively, based on available data on water quality in the lower Vltava and the lower Czech Elbe, i.e. the section between the profiles Podolí and Zelčín (Vltava above Prague and above the confluence) and Obříství (Elbe above the confluence) and the profile Hřensko/Schmilka (Elbe on the state border). The text is based on a paper of the same name presented at the 20th year of the Magdeburg Seminar [1]. Both the Vltava and the Elbe have approximately the same long-term average flow at the confluence but they differ significantly in the size of the river basin, in the total population with the same average population density, in location of industry and in morphology of the river and river landscape (Tab. 1). The morphology of the river valley enabled the construction of important valley reservoirs on the Vltava, which regulate the flow through Prague, especially in dry periods when they maintain the flow above about 50 m3/s. The Elbe does not have these possibilities even potentially and, in dry years, the influence of flow regulation by discharge and accumulation in the Orlík reservoir is evident even in the Hřensko profile. In terms of the relative load of the watercourse, the discharge of wastewater into the river at the local long-term average flow for Prague represents 1.25 %. For important settlements on the Elbe it is only 0.52 % for Hradec Králové and Pardubice (calculated in relation to the Elbe, not for Velká Strouha), 0.075 % for Kolín and below the confluence with the Vltava only 0.059 % for Ústí nad Labem and 0.026 % for Děčín. This proportion changes significantly at low flows and becomes vital during long-term off-season drought. Clearly, the definition of ”drought” differs for individual profiles and their river basins; however, if we consider it a reliable limit of 25 % of the long-term average flow, we must consider a fourfold load of polutants to a watercourse compared to the average. The only source for possible improvement of flows is the Vltava cascade, and manipulation of the flow are reflected even in the Hřensko border profile. The Elbe above the confluence does not have these technical possibilities, so in dry periods the flow in the Elbe profile of Obříství is significantly lower than in the Vltava profile of Zelčín.
Tab. 1. Basic characteristics of subbasins studied

The development of water quality and its monitoring in the area is described in older publications [2, 3]. Good reference data characterizing the whole annual cycle of water quality are available for assessing the development. The paper of Franz Ullik [4] is essential; in the period from 13 January 1877 to 13 January 1878, he took one sample every day from the Elbe in Děčín (from the ferry, i.e. roughly from the middle of the river) and published the complete results. For Vltava, it is the work of František Schulz from 1913 [5]. After that, only individual publications are available and systematic data begin around 1970, when systematic monitoring of the quality of Czechoslovak rivers gradually began to take place, managed by the Czechoslovak (now the Czech) Hydrometeorological Institute (CHMI). Until 2008, data from this monitoring were fully accessible for public; now they can be obtained on the basis of an application and a relevant contract for their use for precisely specified purposes. The historical development of water quality in the Vltava and in its catchment area above river km 100 (profile Živohošť on the Slapy reservoir) has been reconstructed and is systematically monitored, by the team formerly led by L. Procházková, now by J. Kopáček. Its links with waste management, agriculture, deposition, and discharge in the river basin are published [6-9].
METHODOLOGY
The data presented in the text were obtained within the project ”Water for Prague” [3], but mainly from excerpts from printed and digital yearbooks Water quality in streams published by CHMI and from public databases managed by CHMI. The data series from the Zelčín profile was linked to the historical profile of Vepřek, similarly the data from the Obříství profile to the historical profile of Na Štěpáně. Data from 2008 come (through CHMI) directly from their acquirers – Povodí Vltava and Povodí Labe State Enterprises. Data on daily flows on the days of sampling were obtained by downloading from the public database on the CHMI website.
RESULTS
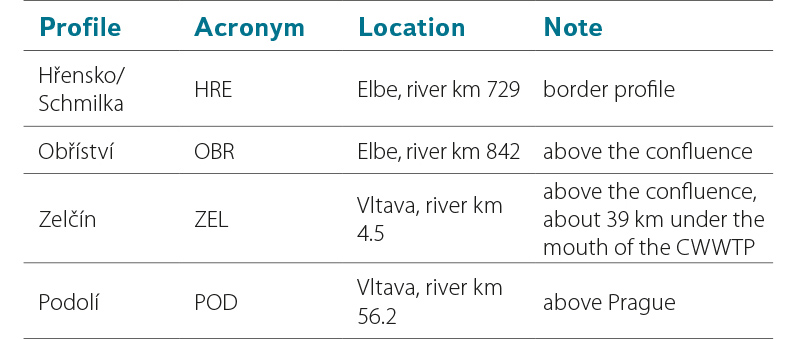
The results are based on processing of the data from monitoring on the following profiles:
Tab. 2. Localization of monitored river profiles
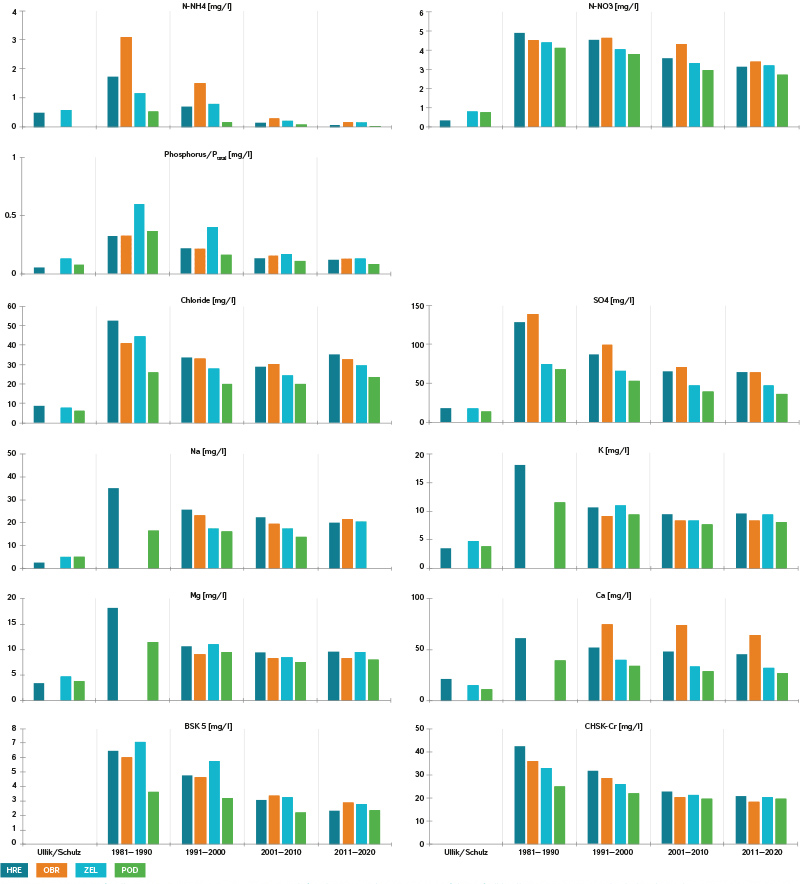
The development of concentrations of basic components – water quality indicators – in the section between the confluence of the Elbe and Vltava and the border profile Hřensko/Schmilka (section of about 110 km) is shown in Fig. 1. The graphs are processed as ten-year averages, with some values still missing in the ”beginning” period 1981–1990. The first series of columns in the graphs presents the reference historical data of Ullik (Elbe, 1877) and Schulz (Vltava, 1913) after recalculation to the current methods of presentation (N-NO3, Ptotal, etc.). Significantly, today‘s ion concentrations are generally higher compared to ”history”, even though they now have a steady or declining trend. Ammonia nitrogen is now at its original level, but the overall supply and transport of nitrogen by rivers has increased significantly. At present, nitrate is completely predominant in rivers (a hundred years ago an unknown or insignificant anion in the world‘s rivers). Sulphate and calcium concentrations are generally decreasing. The development is in line with the supply from the Vltava basin [7, 9] and certainly also with the changes in the discharge of industrial wastewater into the Elbe above the confluence, which took place mainly in 1985–2000. The increase in flow between the Podolí and Zelčín profiles is insignificant, so the graphs also show the contribution of Prague in the form of an increase in concentrations between the Podolí and Zelčín profiles, which is mostly insignificant.
Fig. 1. Concentrations of pollution components – ten/years means; left columns are the year means of data of Ullik (Elbe – Děčín, 1877) and Schulz (Vltava downstream Prague, 1913)
The favourable development of water quality in the Elbe in the Němčice-Hřensko section and in the Zelčín profile is documented, for example, by the content of toxic metals (As, Cd, Pb, Hg) in benthic organisms [10].
Even though concentrations are considered as a basic indicator of water quality in rivers, enabling the quality control, search for pollutants, etc.; however, for the purposes of our work, the transport of pollution components through individual relevant profiles is important for the purposes of our paper (i.e. concentrations multiplied by the daily flow – Qd). In general, fluctuations in transport data are significantly more affected by fluctuations in daily flows than fluctuations in concentrations; nevertheless, monitoring data provide 12 evenly distributed ”situations” each year for which transport can be calculated by multiplying concentration and flow. It is clear from the development of concentrations that the last twenty-year period is already stable – that is, relatively constant concentrations (their annual courses), and thus that transport is controlled mainly by flow and depends on the type of supply of individual substances to the flow. The graphs for transport are processed similarly to the concentrations in Fig. 2. The sum of the transport through the Elbe and Vltava above the confluence is included in the graph (OBR + ZEL), to demonstrate a clear difference from transport through the Hřensko border profile. The Podolí (POD) profile is not included here because the differences in the flow through the Podolí and Zelčín profiles are negligible and the transport differences are given only by the concentration difference shown in Fig. 1. BOD5 and COD-Cr values are generally considered as non-conservative components of pollution, controlled by microbial degradation of organic carbon in the stream, but their development (decrease) over time generally corresponds to other components.
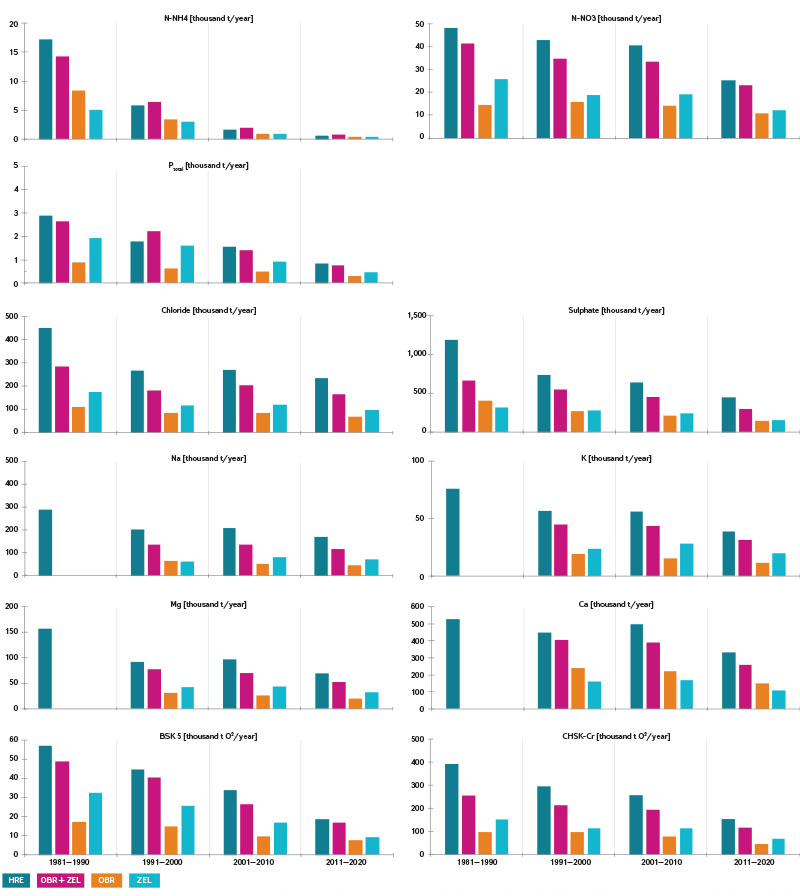
Fig. 2. Ten-years means of transport through monitored profiles in thousand tons per year; second column represents the sum of transport/supply by Elbe and Vltava at the confluence
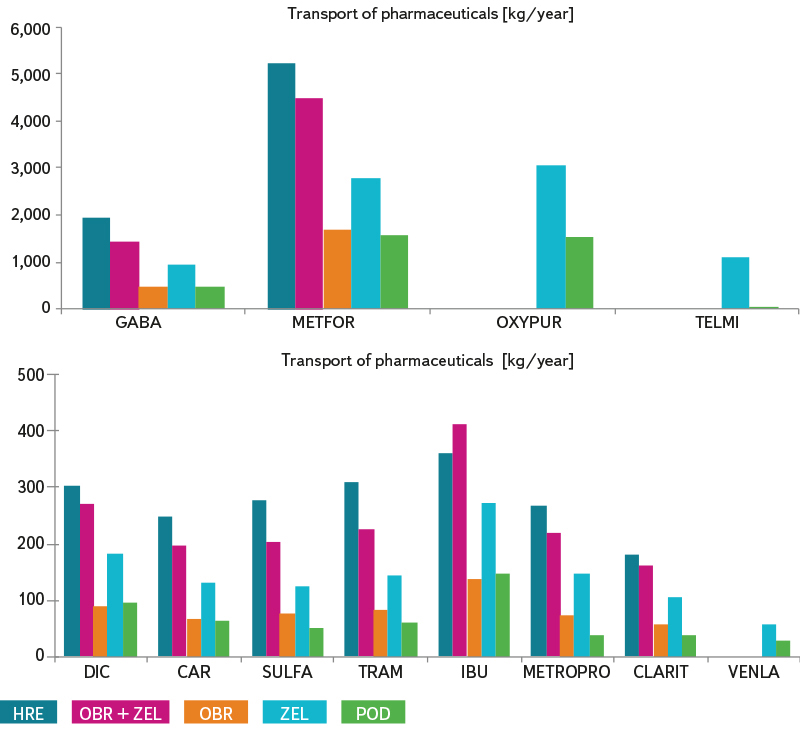
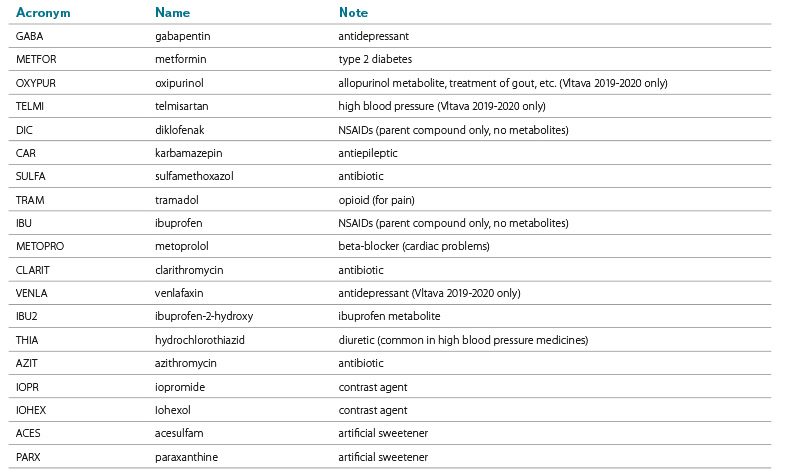
Over the last 20 years, we have gathered more and more quality information about the ”new” component of pollution – pharmaceuticals that, after use, entered into WWTP via sewage and from them into watercourses [11]. Reliable data series based on standardized LC/MS techniques have been available for the last 10 years or so. This reliable analytics is the precise work of the teams of colleagues M. Koželuh (Povodí Vltavy, State Enterprise) and M. Ferenčík (Povodí Labe, State Enterprise), and we can only look forward to further data and hope that they will be published in a comprehensive manner. Fig. 3 provides similar data on pharmaceuticals’ transport in the period 2010–2020 for substances that commonly occur in the Vltava and Elbe in determinable concentrations. Their list, with a brief comment, is given in Tab. 3. For the long-term study items (ibuprofen, carbamazepine, and diclofenac), data are available for this whole period, for other pharmaceuticals for a shorter period – for gabapentin, tramadol, and clarithromycin for 7–9 years, for metformin for 4 years. Only from the Vltava do we have data for oxipurinol and telmisartan (2019–2020) and for venlafaxine
(5 years). Only those pharmaceuticals whose concentrations were reliably higher than the limits of quantification of the analytical methods used (0.01–0.05 µg/l) were included in the evaluation. In the case of the relatively clean Podolí profile, we accepted cases ”below the limit of quantification” if they occurred a maximum of two to three times a year, and we included them in the graphs as values corresponding to the limits of quantification. Therefore, the values of transport to Prague, for example for ibuprofen, are slightly overestimated.
Tab. 3. List of pharmaceuticals dealed in Figs 3 and 4
DISCUSSION
The graphs characterizing the development of concentration and transport of long-term monitored classic components/indicators of pollution show that Prague and the Vltava below Prague today is not a significant source of pollution for the Czech Elbe river basin (for exceptions, see below). This is due to the gradual modifications of the WWTP on the Vltava and the Elbe, as well as the disappearance or transformation of significant industrial pollution sources. The water in the Elbe above the confluence has a significantly higher concentration of sulphate and calcium; however, we do not have historical data from the turn of the 19th and 20th centuries from the Obříství profile. Historically, the concentrations of the monitored components in the Elbe were higher than in the Vltava, and in the last decade the Vltava has had a higher share in the pollution of the Elbe only because it has higher flows. These are, as already mentioned, supported in the summer by discharge from Orlík reservoir. The development of nitrogen and phosphorus transport by the Vltava River corresponds to the results of Kopáček et al. [7, 9], including their reconstructions of the historical state. For nitrogen, now predominantly present only as nitrate, about 75 % comes from non-point sources, while phosphorus comes mostly from point sources, even with relatively efficient chemical removal in WWTP [2]. Nitrogen in ammonia form occurs today only in river sections below the effluents from WWTP, especially in winter when the water temperature limits the metabolism of nitrifying bacteria. However, winter discharge of N-NH4 is supported by Government Decree 401/2015 Coll., which allows it to treatment plants with up to 10,000 connected inhabitants at temperatures up to 12 °C (in WWTP), even if this means a threat to rivers, especially to smaller watercourses. In the monitored section of the lower Vltava and Elbe, this probably does not affect the measured values much. Nitrate concentrations also show a seasonal course, namely a slight negative correlation with water temperature and a positive correlation with flow, which can be explained by both the activity of non-point sources and the intensity of nitrification. A similar cycle for N-NH4 and N-NO3 can be observed in the Ullik data set [4].
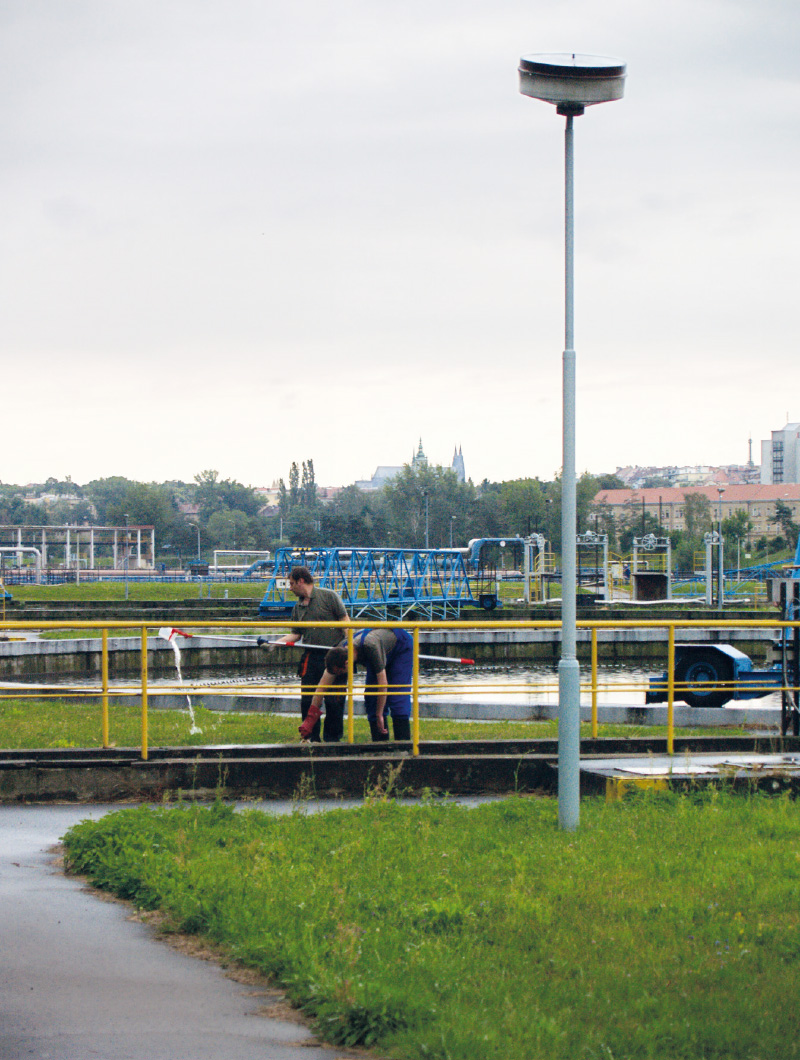
Sampling in the Central Wastewater Treatment Plant. (Photo: J. K. Fuksa)
The improvement is evident because, in the period 1980–1990, the concentrations of ammonia nitrogen in the Hřensko profile were still so high that the theoretical oxygen consumption for its nitrification was comparable to the BOD5 values, for which a significant share of oxygen consumption is due to organic carbon oxidation. It is important, however, that nitrate nitrogen, today in concentrations of 3-4 mg/l N-NO3 in Hřensko, will reach the sea without any losses. The decrease in sulphate and calcium transport also corresponds to a general decrease in acidification, industrial pollution, etc. [9]. In this respect, it can generally be said that the current pollution of rivers is, according to long-term indicators, consistently at a low level, and only nitrogen and phosphorus remain an issue. This also applies to BOD5 and COD-Cr, whose values are now on the border of the natural background in the monitored area. However, because the ”excess” of phosphorus persists despite its regulation, the course of BOD5 and COD in the rivers downstream shows a seasonal character, determined by the production of phytoplankton, still insufficiently limited by the discharged phosphorus. The proportion of total phosphorus determined as P-PO4 is of particular importance, the so-called soluble or phosphate phosphorus, which largely comes from WWTP and is directly accessible as a source of phosphorus for the biomass of photosynthetic organisms in the river (biofilms and phytoplankton). In the graphs and budgets, we work only with the values of the concentration of total phosphorus (Ptotal) which, in contrast to the share of P-PO4, are relatively robust and we have longer time series for them.
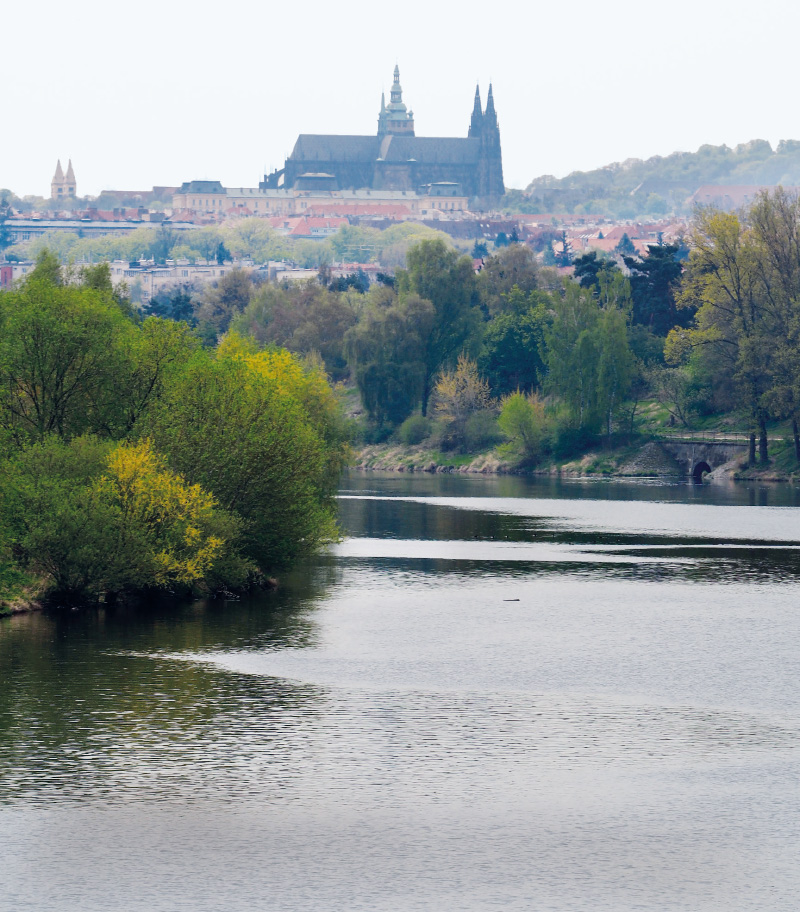
View from the right bank of the Vltava – every historic town today has an old castle and a modern wastewater treatment plant. The “old” spout is visible in the right part of the image. (Photo: J. K. Fuksa)
This article deals with the problem of pollution and eutrophication at a general level and therefore avoids comparisons with legislative standards and limits. Enforceable limits are often a compromise between the need to protect rivers/wastewater recipients and the protection of the standard technical capabilities of WWTP operators. However, it should be noted that the level of pollution of watercourses and the search for problematic sections must be assessed according to the concentrations and transport budget for individual components and according to their seasonal and long-term development. Simplified approaches, such as historical determination of purity classes (with ”updated limits”), tend to obscure the solution. Moreover, if we take into account the trend of climate change, i.e. long periods of low flows with constant discharge from WWTP, the assessment according to average annual data is not sufficient in general.
For comparison with the development of water quality in the Elbe further downstream, the latest public data of the International Commission for the Protection of the Elbe River (ICPER) from 2010 are available [12]. Even then, the water quality parameters in the Hřensko/Schmilka border profile were ”better” than in the Magdeburg profile [2]. The values for downstream transport increase with the size of the stream; if the concentrations do not increase, it can be said that the substance transport by the Elbe from the Czech Republic to Germany cannot be considered as pollution, but is a picture of comparable levels of river load, wastewater treatment, etc. in both countries.
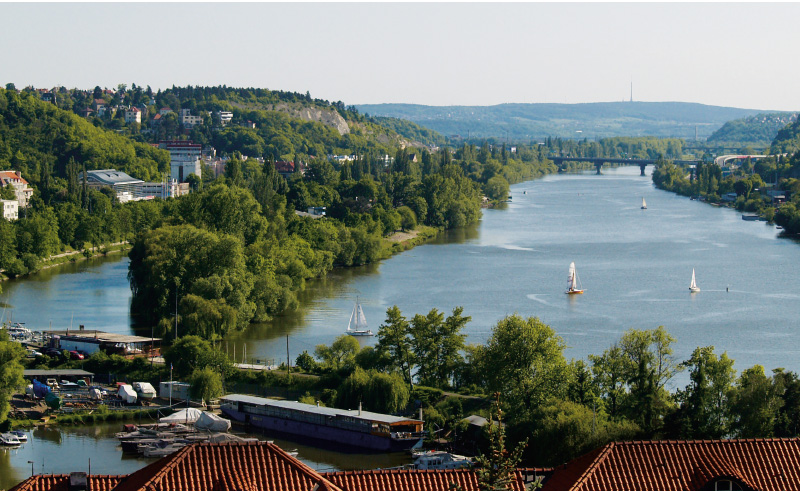
Vltava above Prague, view from Vyšehrad to the south. The Vltava flows through the Orlík and Slapy reservoirs, which affect its quality and temperature regime – in summer it is still
cold in Prague and gradually warming up, in winter it is relatively warm and therefore it does not freeze for years. The Berounka flows from the left, which is not yet perfectly mixed
with the Vltava in this section due to temperature differences. (Photo: J. K. Fuksa)
Specific pollutants are a new problem; in addition to pesticides, these are especially pharmaceuticals. Their consumption is difficult to reduce. Their supply into the streams is determined only by their amounts, which after use and excretion, pass through the sewerage and the treatment plants into the rivers. The graphs in Fig. 3 show that Prague is a significant source of pharmaceutical pollution, but that many substances already come from the river basin upstream. About 30 % of the long-term flow through Prague comes from the Berounka and Sázava. If we consider the theoretical retention times in the Vltava cascade on the Vltava section above Prague (Orlík about 99 days, Slapy about 37 days), the resistance of metformin, gabapentin, oxipurinol (metabolite of allopurinol), and so on is remarkable. However, theoretical retention times can only be used in general to estimate the effect on the flow rate of substances downstream, as they only apply to the long-term average flow through a full and non-stratified reservoir. In reality, the water from the influx migrates through the stratified reservoir according to the current temperatures/densities and the individual layers proceed separately (according to the discharge to the turbines). In addition, the volume of Orlík fluctuates during dry years according to the fortification of flow through Prague, which further shortens the real retention times.
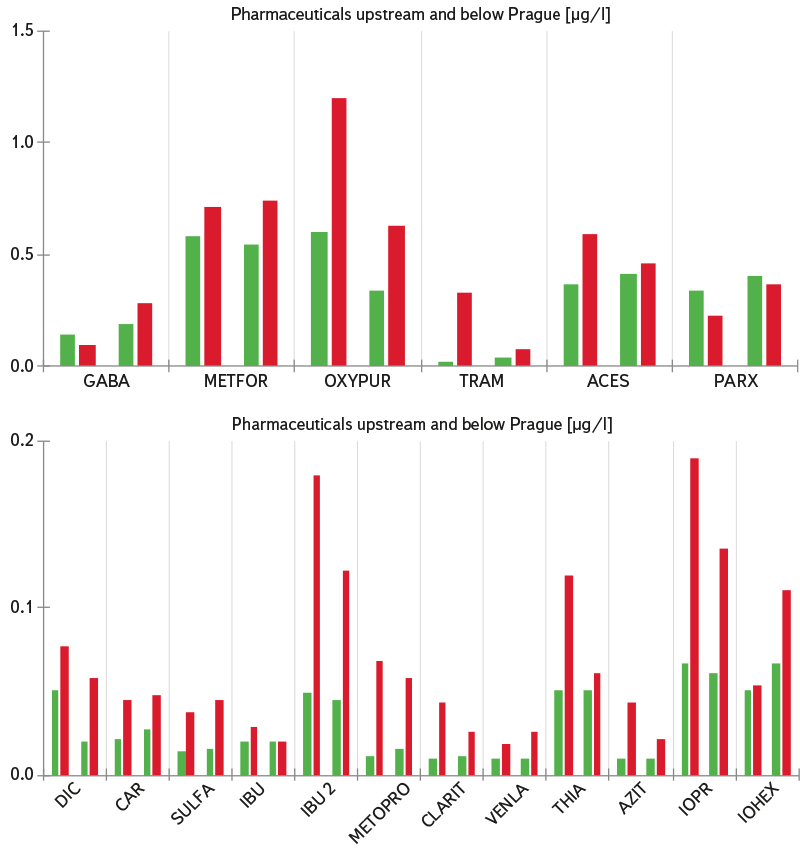
If we recalculate the transport of resistant pharmaceuticals to the number of inhabitants upstream the individual monitored profiles, the differences between the profiles are significantly reduced because the consumption of pharmaceuticals is uniform in the population. Therefore, we can generalize data from downstream river sections, in contrast to the monitoring of small river basins [13], in which ”islands” with specific pharmaceutical production (hospitals, etc.), as well as dilution by rainwater overflows can have a significant effect. Fig. 4 shows the concentrations of selected pharmaceuticals in the longitudinal profile of the Vltava during its flow through Prague (section 14.3 km) in two flow and temperature situations. By selected pharmaceuticals, we mean those with regular occurrence. Orlík and Slapy reservoirs affect the temperature regime of the Vltava; therefore, the Berounka gradually mixes into it from the left and the river is not thermally homogeneous until the profile of Železniční most (the Railway Bridge). Therefore, the graph shows the profiles of Železniční most (above the centre of Prague, river km 55.4) and Sedlec (about 2 km below the outlet from the WWTP). At the two control profiles between them, the ratios correspond to the Železniční most profile (for more detailed information, see [3]). In contrast to Fig. 3, other substances of typically anthropogenic origin are shown in the graphs – tracers, artificial sweeteners, and the most common metabolite of ibuprofen. The results correspond to the transport balance in the whole river basin, shown in Fig. 3. For pharmaceuticals, we practically do not have any data below the Hřensko profile, but the comparability of the Elbe pollution level in the Czech Republic and Germany probably also applies to them, although different habits in their consumption may occur.
Fig. 3. Transport of pharmaceuticals through river profiles [kg/yr] – means for the period 2010–2020. Second column represents the sum of transport by Elbe and Vltava upstream the confluence. For acronymes see Tab. 3.
Fig. 4. Concentrations of pharmaceuticals upstream (Železniční most, green columns) and downstream (Sedlec, downstream discharge from Prague WTTP, red columns)
Prague. Situation on 8 November 2017 (left pairs) and 19 July 2018 (right pairs). Beside of frequent pharmaceuticals (see Fig. 3) some substances are added, incl. artificial
sweeteners. For acronymes see Tab. 3.
Discharge and transport of pharmaceuticals is a serious problem and, in general, an undertaking for further monitoring. These are mostly substances that are not ”interesting” for microbial communities in WWTP as a source of carbon and energy. Their concentrations are low, so they do not support the selection of degrading microbial strains or the activation of appropriate enzymes. Their degradation is therefore at most only partial, and if they are not absorbed into sludge, etc., they largely pass into rivers. Technologies for their effective disposal in WWTP are still far away and disposal in large drinking water treatment plants (sorption technology) is not a solution for wastewater discharge. Due to the fact that WWTP are the only source of pharmaceuticals, their transport can also affect groundwater in the floodplain, including sources of drinking water. The influence of pharmaceuticals on river communities is constantly demonstrated – they act as endocrine disruptors, they influence behaviour (perception of predators and protection against them) and so on, although many publications show these effects at concentrations significantly higher than the actual concentrations in watercourses – Czech as well as global ones. Again, there is a risk of long-term low flows due to climate change – supply from WWTP is stable, but in long-term drought the proportion of treated wastewater in streams increases and the impact of residual pollution may be more pronounced, especially when low flows affect the hydromorphological characteristics of streams and their temperature regime. This applies not only to pharmaceuticals, but also to phosphorus and other substances.
One of the issues in the interpretation of discontinuous monitoring data is the possible effect of rainfall overflow dilution by the sewerage system during rainfall events. For a city the size of Prague, with sewerage connected at one central WWTP, it can be assumed that in the event of rainfall, dilution effect will not be active for the entire city. Therefore, in the case of lower streams of rivers and large settlements, this phenomenon will be significantly less significant than in small streams and can, therefore, be neglected. For small settlements with a smaller area on smaller rivers, i.e. on watercourses with lower flow and a smaller catchment area, the effect of short-term rainfall dilution is far more significant and makes it practically impossible to generalize at the level we are using for the lower Vltava and Czech Elbe. Our text attempts to synthesize data from the last 40 years and compare it with historical development. We assume that our generalizations will lead to a deeper analysis of large data sets on water quality in the rivers of the Czech Republic and the factors that affect it.
CONCLUSIONS
- In the area of classic pollution indicators, Prague is not a significant source of pollution of the Vltava or the entire Czech Elbe river basin. The only exception is the supply of phosphorus. Further reduction of phosphorus supply from WWTP is therefore essential, regardless of compliance with current discharge limits.
- The level of classic pollution indicators in the Hřensko/Schmilka border profile is completely comparable to the level further downstream in Germany.
- From a historical point of view, the concentrations of pollution indicators, but also chloride, sulphate, alkali metals (Na, K), and alkaline earth metals (Mg, Ca), are significantly higher than those found in 1873 (Elbe) and 1913 (Vltava), but they are gradually declining.
- Prague is a significant source of pharmaceutical pollution because the level of their elimination in WWTP is generally insufficient. In the current state of treatment technologies, this is mainly due to the number of inhabitants in the river basins as consumers and producers of pharmaceuticals and other PPCPs. The transport of resistant pharmaceuticals by rivers is long-distance and depends mainly on the number of inhabitants in their catchment area.
- The development of river quality in the Czech Republic should be examined in detail, partly because the increasing occurence of long-term low flows (due to climate change) can lead to serious problems with river quality with the constant supply of standardly treated wastewater, even when meeting current discharge limits. A solid methodological apparatus and basic data sets are already available for monitoring the load of rivers by discharging pharmaceuticals, and it is necessary to start a targeted survey of the mechanisms of their supply, including the functions of WWTP and sewerages, including rainfall overflow dilution effect.
- The monitoring of water quality in watercourses itself should support the development and implementation of more sensitive methods for the detection of pollutants that are ”new” or have been below the limit of quantification of established methods for a long time. As a result, the regular water quality monitoring used here would also communicate better with the monitoring operated in accordance with the requirements of the EC Water Framework Directive (2000/60/EC).
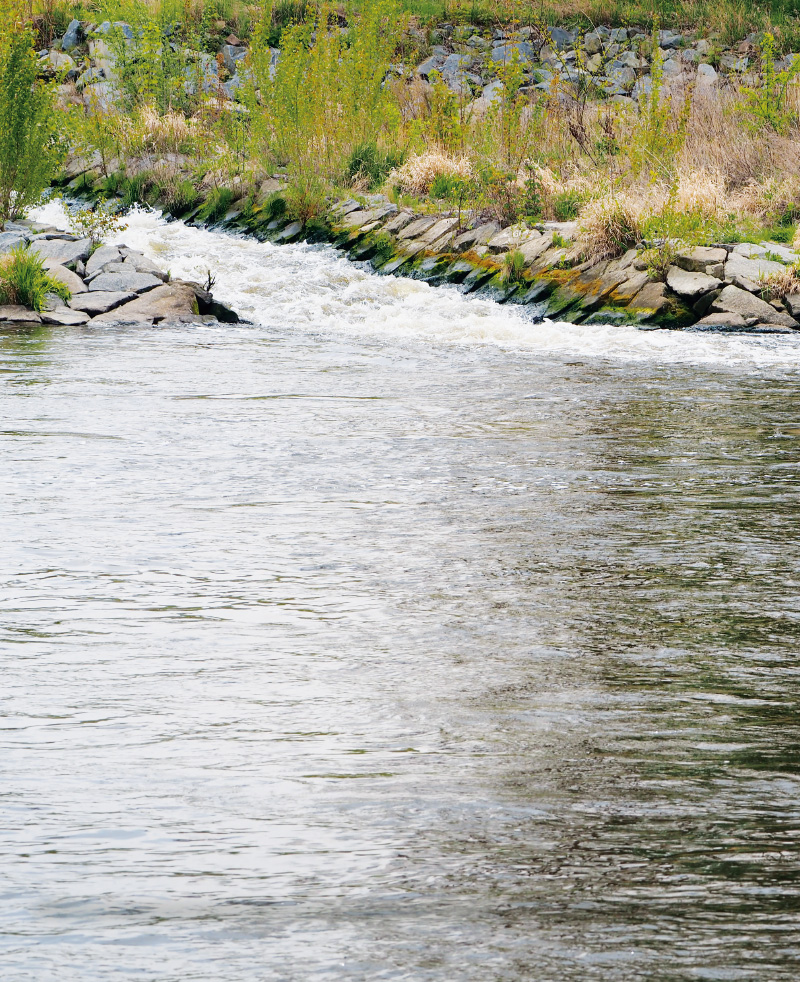
This stream with clean banks in the picture is an outlet from the new water treatment plant of the WWTP, which has been in trial operation since 2018 and opens just above the
“old” outlet. (Photo: J. K. Fuksa)
ACKNOWLEDGEMENTS
The data for the publication were partly obtained within the work on the grant Growth Poles – Water for Prague and the sub-project ”River flow in urban areas – determination and optimization of anthropogenic pressures” (CZ.07.1.02/0.0/0.0/16_023/0000118). The authors thank Povodí Vltava and Povodí Labe State Enterprises for providing the data and V. Kodeš from CHMI for their editing and transport. Special thanks go to the reviewers who made a significant contribution to the final form of the text.
This paper has been peer-reviewed.
