SUMMARY
This paper shows the partial outcomes of a study focused on monitoring gully erosion in the Myjava river basin. The study showed the progress of dynamic changes in gully erosion in the location of Turá Lúka using various surveying techniques from 2014 until present. The study shows that selection of the surveying technique depends on various criteria and the aims of the task, where each possesses advantages and disadvantages. In the case of determination of the parameters of gully erosion (volume, length, and position), one of the suitable surveying techniques is Terrestrial Laser Scanning (TLS) as well as Unmanned Aerial Vehicles (UAV), which results in a point cloud. Measurement using Global Navigation Satellite Systems (GNSS) with a GPS device is sufficient for assessing gully erosion in transverse profiles, more complex sections, or in places with built anti-erosion and stabilization dams in a gully. This assumption was confirmed based on results from field measurements of an erosion gully by GNSS technology in 2017–2021. Evaluation of the results is given in this article. The given method of mapping the erosion gully was chosen for the need for detailed profile evaluation of previously identified critical sections (transverse profiles) of the monitored erosion form based on field surveying and area scanning and for simple data processing. The simplicity of this method due to the type of task, staffing, time, and volume of data predetermines and confirms the suitability of its selection for use under the given circumstances. When choosing this measuring technique, the requirements are easy access to the measuring point and a good satellite signal for GPS devices influencing the accuracy of the measurement concerning the surrounding vegetation. Sufficient testing and comparison of available surveying techniques make it possible to efficiently and realistically select suitable effective technology for monitoring erosive forms in the landscape for a predefined purpose. Contributions of this type will help researchers of similar tasks in decision-making when choosing the most suitable landscape surveying technology.
INTRODUCTION
In its acceptable form, soil erosion is a natural process occurring in the landscape; however, in terms of the long-term negative effect on the productive capacity of the soil, this type of soil degradation should be considered as a significant environmental threat [1]. Nevertheless, imprudent anthropogenic activities in the landscape often contribute to an increase in soil erodibility [2]. Water erosion is one of the most significant environmental degradation risks which have a negative influence on the deterioration of basic soil parameters and soil functions in Slovakia. Its unacceptable or accelerated form on agricultural soils not only significantly affects both productive and non-productive soil functions, but it also has high potential to threaten built-up areas in the form of muddy flash floods. These are caused by extreme rainfall falling on a relatively small area of land over a short period of time, when there is concentrated surface runoff and transport of soil particles from higher agricultural areas to areas of lower altitude. This disruption of the soil profile creates indentations (rills and gullies) in the land surface which tend to deepen over time. In addition to the defining characteristics of the relief in terms of soil erosion (i. e., the contributing area and slope conditions), the concentration of surface runoff is often determined by farm roads with fall-line and oblique orientation, interfaces between fields, and furrows left by the wheels of agricultural machinery [3]. The consequence of accelerated and concentrated runoff and erosion processes is the existence and intensive formation of temporary or permanent erosion rills and gullies. In order to solve gully erosion, it is necessary to determine its location, and to measure and monitor the development of its changes and dynamics for the design of elimination or stabilization measures.
Modern advanced technologies, which are associated with experimental field work and data collection, are currently used for the purposes of modelling [4, 5] and monitoring natural erosion-transport processes and their elements in the landscape [6–9]. Progressive monitoring techniques mainly include Terrestrial Laser Scanning (TLS), Light Detection and Ranging (LIDAR), and the use of Unmanned Aerial Vehicles or drones (UAV). They make it possible to obtain information on land use type, morphology, and vegetation cover characteristics [10–13] in a relatively short time, over relatively large areas, and without the need for field work. In some cases, however, the use of these technologies is impractical and cannot be easily applied, either because of the location of the erosion feature (rill or gully) in the landscape, its dimensions, or the vegetation cover. Classic methods and measurement techniques, such as geodetic measurements (tachymetry) or global navigation satellite system (GNSS) methods, can then be used to acquire and collect spatial data of these surface and linear undesirable forms of soil erosion.
This paper aims to summarise the findings and results from field measurements in the form of a case study and to analyse the occurrence and dynamics of the erosion gully development in its critical sections (transverse profiles) within the site of Myjava – Turá Lúka by means of continuous long-term measurements (for 2014–2021) using GNSS technology.
STUDY REGION
The area of the Myjava Hills (Myjavská pahorkatina) is situated in western Slovakia and is characterised by a significant occurrence of erosion rills and gullies, the formation of which is associated with shifting cultivation and colonisation, accompanied to a large extent by deforestation of the area and its subsequent use for agricultural activities. The ruggedness of the terrain, significant slope conditions, large-scale cultivation of land, and specific land use (especially the slopes used for cultivation) create ideal conditions for the formation of erosion-transport and runoff processes, which give rise to a harmful form of soil erosion (erosion rills and gullies).
The monitored erosion gully is situated on a cultivated slope near the residential district of Turá Lúka – Myjava. The slope research area has 0.3 km2 in the flysch zone with limestone blocks of the White Carpathians and it is located in the geomorphological unit of the Myjava Hills. From the pedological point of view, it is mainly dominated by Cambisols. In terms of climatic conditions, the area belongs to a moderately warm, humid zone with cool to cold winters, with an average annual rainfall of 600–700 mm and an average annual air temperature of 8 °C. From the hydrological point of view, the area is particularly vulnerable in the summer (the highest rainfall was recorded in May–July) and in the winter-spring period when snow and precipitation melt. The combination of hydrometeorological conditions, relief, land use, and low permeability of the bedrock contribute to the development of the erosion gully in the area. At present, the length of the gully is approximately 300 m, and its average longitudinal slope is 10%. Based on military mapping, occurrence of this erosion form was identified in the study region as early as in the 19th century [14]. In the 1990s, the erosion gully was filled in with soil and the area was then used for agricultural purposes. Over time, under the influence of heavy rainfall and snowmelt in the rugged terrain, an erosion rill, which tended to expand into a gully, was re-established in the fall line of the large-scale cultivated slope. Due to development over time and the parameters (length and depth) of the erosion gully, it could no longer be cultivated and was consequently classified as permanent. The gully was left to become overgrown with self-seeded trees and permanent grassland (to aid its stabilisation) and was removed from agricultural use (Fig. 1).
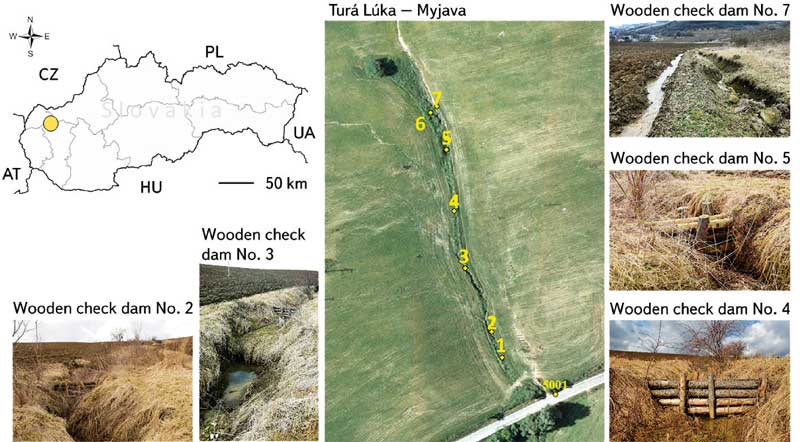
Fig. 1. Location of the study region of the erosion gully with 7 small wooden check dams
Due to the occurrence of muddy floods after torrential summer rains and during spring snowmelt, when extreme surface runoff along with eroded material caused siltation of roads and residences, the erosion gully was included in the project “Landscape Revitalization and Integrated Watershed Management Programme of the Slovak Republic” in 2010. Within this project´s implementation, seven small wooden check dams were constructed in the gully as a form of anti-erosion and stabilisation measures (Fig. 1).
MATERIAL AND METHODS
The monitoring of the erosion gully site in Myjava – Turá Lúka was closely linked to the RECARE project (2014–2019, implemented under the EU 7th Framework Programme), the results of which were used in the development of EU legislation aimed at soil protection and ensuring sustainable agriculture and food security. Several surveying techniques were applied to measure the erosion gully (in 2014–2021); their selection depended on availability, time demands, accuracy of the measurements, but also on the conditions resulting from the season of the field measurements and the occurrence of vegetation cover. The field measurements were carried out at least once a year and the monitoring has continued until now.
In 2014, the study region was mapped using UAV technology, namely the unmanned aerial vehicle Gatewing X100 with fixed wings. In the spring periods of 2015 and 2016, the erosion gully was measured in detail using TLS technology, namely the Trimble TX5 3D laser scanner with phase shift measurement accuracy of 2 mm/25 m. The application of these modern technologies for landscape surveying was associated not only with the planning and preparation of the measurement, the collection of point data in the field and experimental work, but also the subsequent processing of the measured data and, last but not least, analysis of the results, including evaluation of the territory´s geomorphological characteristics. Partial results of these measurements were published continuously in [15].
The use of modern surveying technologies to monitor erosion features in the landscape requires that the land surface be largely cleared of extensive vegetation (e. g., grassland, shrubs, and self-seeded trees), which is labour and time intensive. That is why, since 2017, the erosion gully has been monitored only using GNSS technology, i. e., a Leica System GS15 GNSS with a connection to the Slovak Real-Time Positioning Service (SKPOS, generating so-called network corrections of geodetic coordinates in real time), because of the presence of full-grown vegetation in the gully. This technology is easy to process the measured data, but data collection requires creation of a point field, i. e., a density of points, where each point has a precise horizontal and vertical position. Fig. 2 shows the state of vegetation when changes were measured in the erosion gully in 2017–2021.
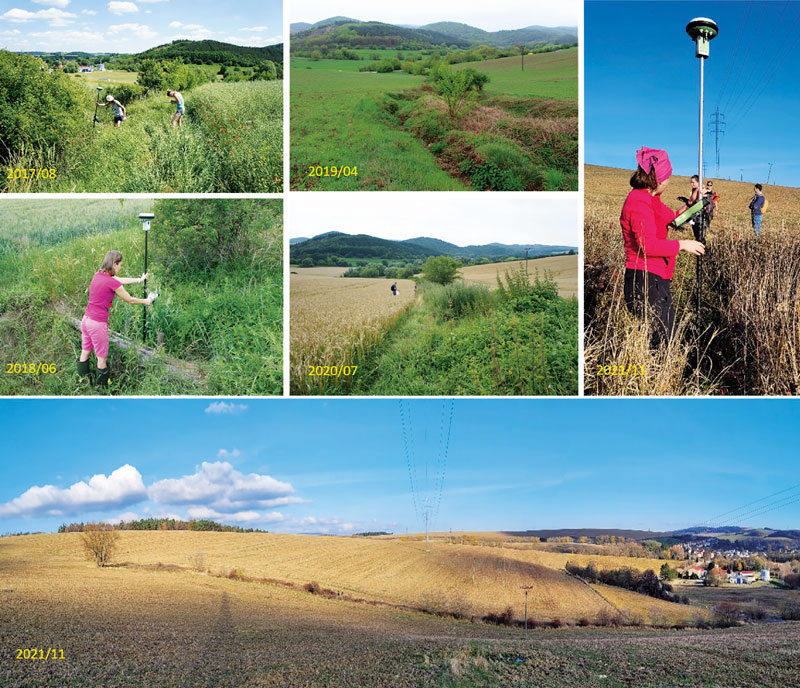
Fig. 2. The photo documentation of the erosion gully using GNSS technology from 2017–2021
RESULTS
According to [16], gully erosion was categorised in the past based on the determination of the gully´s basic parameters (length, slope, average depth, and width). These parameters were mostly determined in evenly spaced transverse profiles. In the case of the erosion gully, monitoring was therefore aimed at determining its bottom or axis (main line) and edges in the selected 20 transverse profiles along its length (Fig. 3). The reason for this was to detect geomorphological changes of the gully in places where siltation by eroded sediment from higher areas had been proved.
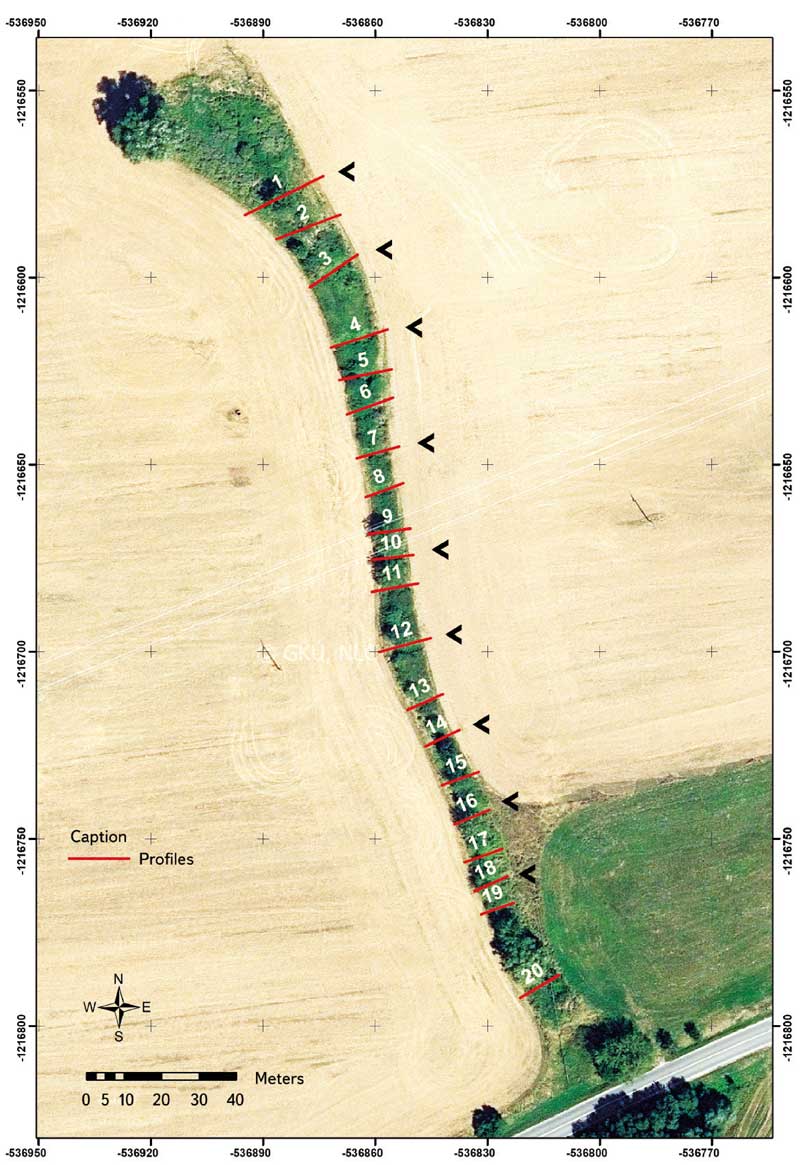
Fig. 3. Location of the 20 transverse profiles in the gully erosion: the black arrow shows 9 selected profiles (base map: GKÚ Bratislava, NLC, 2019)
Information on the date of measurement as well as the number of points measured is given in Tab. 1.
Tab. 1. Overview of measured points in the profiles of the erosion gully using GNSS from 2017–2021

In [17], the effectiveness of anti-erosion measures in the profiles immediately in front of 7 small wooden check dams was reviewed for the period 2014–2017 (Fig. 1), and they were later updated and supplemented in [18]. Geomorphological changes occur along the entire gully, even outside these dams. That is why, in this paper, the analysis of the gully changes was measured on the locations of selected, partly uniformly distributed transverse profiles, regardless of the locations of the dams (Fig. 3). As of 2017, points in a total of 20 transverse profiles are being measured using the Leica System GS15 GNSS, but only 18 profiles have been measured in the last 2 years (year 2020–2021). Profiles 19 and 20 have been excluded from monitoring due to their complete siltation by transported sediment and due to the increasing density of vegetation and trees. The problem is access to the site of measurement and shading of the vegetation itself, as in most cases the satellite signal is lost, thus significantly increasing measurement inaccuracy. In such a case, the possibility remains to measure these transverse profiles using a total station. However, this measurement method has not been applied.
For the purposes of evaluating the erosion gully´s condition, 9 transverse profiles were selected, namely profiles 1, 3, 4, 7, 10, 12, 14, 16, and 18 (Fig. 3). Their graphic representation is presented in Fig. 4. Profiles 1 and 10 (for 2019, marked as NO DATA) are not shown in the results and comparisons because they were not measured due to unfavourable weather and bad access to the site of measurement, or loss of satellite signal.
Some profiles could not be included because their lines of measurement were not completely identical in each year. They were therefore excluded due to the impaired possibility of correct evaluation of the development of change in the erosion gully´s morphology. It was possible to conclude by visual assessment that expected minor changes had become evident in the head, i. e. the uppermost part of the gully. In this widest part of the gully, there are relatively small depths and several small rills alongside. The minor changes are also caused by a lower slope and a smaller drainage area in this part of the gully. Above the head of the gully, water appears on the ground surface throughout the year. The gully already reaches a depth of more than 1 m approximately 80 m from the head of the erosion gully, i. e. from profile 4. It is seen from the graphic representation of the transverse profile measured in 2019 that it has a different course. This is caused by the fact that the direction of the line of points measured in profile 4 was not maintained as it had been in the other years. Consequently, this year was excluded from the overall comparison of the gully´s shape and parameters in this profile. In the central part of the gully (profiles 7 to 14), in a 100–190 m long section, there was no change of the deepest part, i. e. the axis of the main gully. It varies between 1.5–2 m, but the change in shape, or the formation of secondary ephemeral (temporary) rills, was only apparent in profile 12. This section has the highest slope conditions, with slopes of up to 20%. Siltation by transported particles can be observed in the lower part of the erosion gully (comparison of profiles 16 to 18). A more detailed analysis of gully erosion in this location would require repeated measurements using modern technology (UAV or TLS), as was done in 2014–2016, or using GNSS technology with a much higher number of point measurements, which is significantly more time consuming.
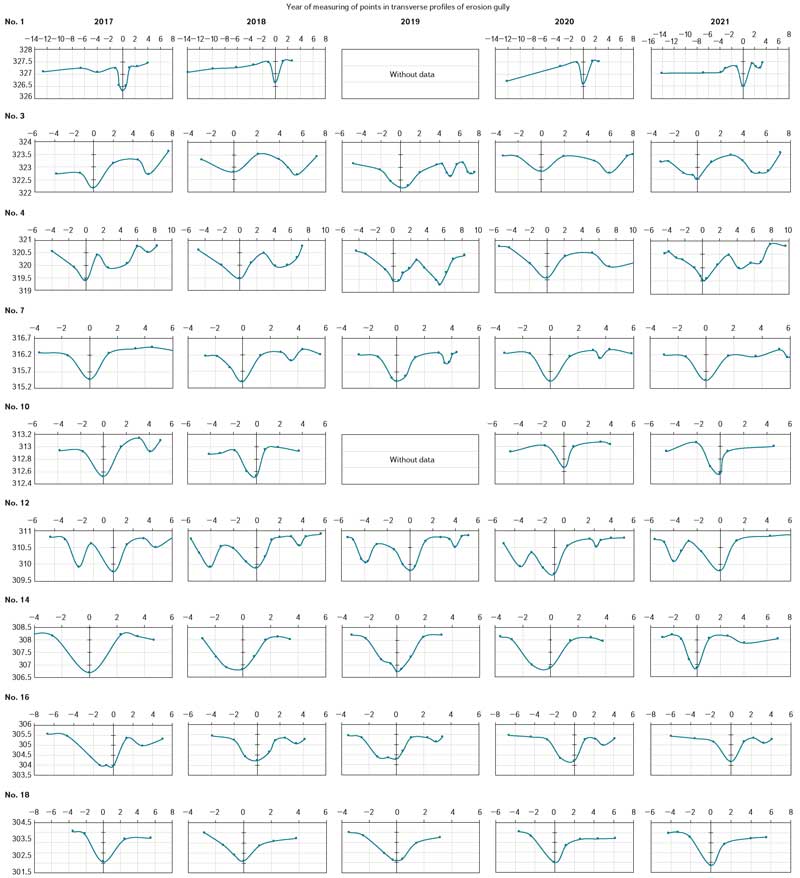
Fig. 4. Selected transverse profiles of erosion gully measured using GNSS technology from 2017–2021
CONCLUSIONS AND DISCUSSION
The paper presents the results of field measurements (2017–2021) of an erosion gully in the locality of Myjava – Turá Lúka. To analyse gully erosion, 9 transverse profiles located along the erosion gully were selected, the points of which were measured using GNSS technology. Their evaluation consisted of comparison of the shape of the transverse profile, change of the maximum depth, which can detect their deepening (incision), bottom silting or erosion, or landslide of the gully´s side slopes. Measurement efficiency is considered to be one of the main advantages of this method, since measurement and subsequent evaluation of the points determining change in the erosion gully´s shape can be carried out by as little as one person. However, care must be taken to measure the points in the same line of the profile so that they can be compared correctly.
Evaluation of the results of field measurements confirmed that the upper part of the erosion gully has a more complex shape, but no significant change occurs in its depth or shape due to the presence of abundant vegetation. In the middle part, slight changes in both horizontal and vertical direction were observed, with the most significant changes occurring in the profiles located in the lower part of the erosion gully, where siltation was expected. It is possible on the basis of long-term monitoring of the erosion gully to review current stabilisation measures as well as the possibility of implementing further protection and stabilisation measures to reduce erosion-transport and runoff processes in the area. Monitoring of the erosion gully is therefore justified and should be continued in the following period, also considering the possible impact of climate change in the form of more extreme torrential rainfall events. ore detailed measurement (e. g. by UAV or TLS technology) would be appropriate every 2–3 years in the spring period due to still undeveloped extensive vegetation, as was the case in 2014–2016. This would ensure evaluation of the position of bed line (the gully´s axis), the gully´s length, and its volume. Point measurements in the profiles in front of the wooden check dams and selected transverse profiles are sufficient once a year. On the other hand, there are several possibilities for field surveying, and it cannot be disregarded that spatial data obtained from Light Detection and Ranging (LIDAR), the Geodesy, Cartography and Cadastre Authority of the Slovak Republic (ÚGKK SR), are now publicly available, too. Data from this source could also be used for this type of task in the future, and it would be interesting to compare them with field measurements.
Acknowledgements
This work was supported by the Slovak Research and Development Agency under contract No. APVV-19-0340 and APVV-18-0347. It was also prepared thanks to the financial support of the grant project VEGA 1/0632/19.
The paper has been peer-reviewed.
