SUMMARY
GIS technologies are widely used in the Hydrology Department of the Czech Hydrometeorological Institute (CHMI). The processing of geospatial data, which are used in hydrology for analytical tasks, and the development of GIS technologies in the last two decades have contributed to the spread of GIS in the CHMI practice. The use of GIS tools is shown in four examples.
The first one focuses on the creation of GIS data. One of the basic source materials for analytical work in hydrology is the polygon layer of four-order watershed divides. Since 2018, these data have been updated, or re-created, on the basis of the Digital Relief Model 5th Generation (DMR 5G) and the updated Polyline layer of watercourses ZABAGED (Basic Geographic Data Base), the geometry and attributes of which are harmonised in cooperation with the watercourse administrators, Czech Geodetic and Cadastral Office and T. G. Masaryk Water Research Institute.
The second example concerns the preparation of input source data for the derivation of the hydrological characteristics of M-day discharge, which, according to Czech Standard 75 1400 Surface water hydrological data, are among the basic hydrological data. The example describes the procedure of deriving a raster layer of long-term annual runoff for the reference period 1981–2010. In this case, a regression relationship between the average annual runoff depth, average annual precipitation, and the average annual amount of potential evapotranspiration over the period was used.
The third example describes the use of GIS in the preparation of hydrological assessments according to the above-mentioned standard (75 1400), which usually result in M-day or N-year-flood discharges in a specified profile of a certain watercourse. For this purpose, a special application has been developed that allows not only to derive the basic physical-geographical characteristics of the watershed from the digital relief model (watershed slope, length and slope of thalweg), but also to determine other necessary characteristics, e.g. the proportion of a certain type of land use in the watershed or the average values of other watershed features (precipitation, CN – runoff curve numbers, etc.).
The fourth example focuses on the use of GIS in operational hydrological service, specifically in the development of the Flash Flood Indicator, which determines the level of risk of flash flood formation or occurrence based on current land saturation and radar rainfall estimates. The scripting and development tools that GIS offers are mentioned here.
INTRODUCTION
Since the data provided by the CHMI have its spatial component, it is impossible to imagine the Institute´s operation without the application of GIS technology. For a long time, GIS has been used not “only” to produce simple static map outputs, but mainly as a tool for data processing and analysis. The trend is to move away from static maps on the CHMI website and in publications, which of course remain a standard part of the use of GIS technology, to dynamic web maps, which have added value in the form of, for example, displaying additional information on map features, searching by addresses or other attributes, zoom tools and possibly other tools integrated into web map applications.
The use of GIS technology in the hydrology of the CHMI is demonstrated in four specific examples in separate chapters. The examples include sophisticated data acquisition in a multi-user database, derivation of raster data from point observations, preparation of data for hydrological modelling and hydrological assessment processing, and demonstration of the use of scripting tools to create automatically launched tasks that include the process from data retrieval, subsequent processing and publication of results in a web environment.
That the path to the above was quite difficult and lengthy is described in the following chapter on history.
HISTORY OF USING GIS IN HYDROLOGY OF THE CZECH HYDROMETEOROLOGICAL INSTITUTE
The GIS technology appeared in the CHMI in the late 1990s, based on the international project “Monitoring and information resources management” funded by the U.S. Environmental Protection Agency (EPA) in 1993-1997. As part of the project, the CHMI Hydrology Department received for free an AV 400 workstation and ArcView and ARC/INFO software licenses (UNIX platform), including system support and training opportunities. The CHMI staff also visited the EPA centre in the USA.
In the initial period, i.e. 1993–1995, GIS was only a peripheral issue in the CHMI hydrology, as it was concentrated in a single workplace and an institute-wide computer network had not yet been built to make the data available to more staff.
A significant improvement of the situation occurred in 1996 and 1997, when the institute-wide computer network was completed and the purchase of additional ArcView licenses together with the necessary hardware improvements led to the expansion of GIS users not only at the central Hydrology Department in Prague, but also at selected branches. These other GIS sites, which were gradually built up during this period, were already PC-based (ArcView, Windows 95 or Windows NT). Thus, as is clear from the above, the GIS technology used in the CHMI hydrology from the very beginning was the ESRI technology.
Data layers, either vector or raster, are essential for working with GIS of course. Compared to the present, there was a shortage of data usable in GIS, especially detailed data that would allow sophisticated analysis.
In 1994, under a grant from the Ministry of Environment of the Czech Republic, the data layers DMÚ200 (vector data 1 : 200,000: waters, roads and railways, energy infrastructure, administrative arrangement, etc.) and DMR-2 (digital relief model, 100 × 100 m raster) were acquired under a contract with the then Military Topographic Institute in Dobruška1. The digital equivalent of topographic maps (DETM) in the form of TIF files at scales of 1 : 50,000, 1 : 500,000, 1 : 1,000,000 and 1 : 2,000,000 was also obtained under the contract with the Military Topographic Institute. While the acquisition of these data was significant, the degree of resolution did not allow for significant analysis.
Therefore, the acquisition of GIS data layers within the CHMI working capacities started in 1997. These were mainly point layers of surface-water and groundwater observation objects and rainfall gauge observations. The most extensive work was carried out in the acquisition of a polygon layer of watershed divides of basic watersheds2 (scale 1 : 25,000, polygon area from 5 km2), in which the CHMI branch offices also participated. The course of the watershed divides had to be first drawn on paper military topographic maps 1 : 25,000 and then digitised.
Once the watershed divide layer was processed, it was possible to perform more detailed analyses and create the first applications using the Avenue programming language that was part of ArcView GIS version 3.x. One of the first applications was the interpolation of point measurements (rainfall) with the incorporation of their regression dependence on the elevation (using the ArcView Spatial Analyst extension), and therefore the first creation of own derived raster data that could be further analysed, e.g. by applying zonal statistics to the watershed area.
A major breakthrough was the acquisition of a digital version of the military topographic maps called DMU25 (Digital Territory Model at a scale of 1 : 25,000) in 2001. This version contained vector layers of feature positions, but also elevation in the form of contour lines. Using the contour line layer, it was not only possible to refine the watershed divide layer of the basic watersheds, but also, based on it, to derive a raster terrain elevation layer with a resolution of 25 × 25 m. This more detailed terrain model (DMR) already allowed its analysis and, in particular, the derivation of the watershed´s physical-geographical characteristics, which include the average watershed slope, the slope and length of the thalweg and other important inputs for hydrological calculations.
Another major milestone in the acquisition of GIS data was the research projects QD1368 “Verification of methods for deriving hydrological source data for assessing the safety of hydraulic structures during floods” (2001–2004) and R&D 1D/1/5/05 “Development of methods for predicting drought and flood situations based on infiltration and retention properties of the land cover in the Czech Republic”, which ran from 2004 to 2007. Within the project QD1368, raster layers of N-year maximum precipitation of 1-, 2- and 3-days duration were derived in cooperation between hydrologists and the CHMI Climatology Department. Other very important data for hydrological modelling were obtained in cooperation with the Research Institute of Land Reclamation and Soil Protection in Zbraslav and in the framework of the above-mentioned research projects, namely vector layers of infiltration capacity and water retention capacity of soils (1 × 1 km resolution), which resulted in a layer of so-called hydrological soil groups. Combined with the updated land use vector layer from the European CORINE (Corine Land Cover) project, it was possible to derive a raster layer of CN (Curve Number) values, which is a key parameter for determining runoff depth from rainfall [1]. The acquisition of these data enabled the full preparation of inputs to hydrological rainfall-runoff modelling and the preparation of hydrological assessments, which is the subject of a separate chapter. The ArcView GIS 3.x software was gradually replaced by the more modern ArcGIS Desktop at the end of the first decade of the 21st century.
Since January 2013, ZABAGED data have become the primary digital GIS foundation, from which – or rather on top of which – new layers of DMR and watershed divides of basic watersheds have been derived or updated. In parallel with the production of the updated Corine Land Cover layers, the raster layers of CN values were also updated. The watershed divides over the ZABAGED data were used in the preparation of so-called M-Day discharge cadastre.
Currently (November 2021), the layer of watershed divides of basic watersheds is being refined, using the Digital Relief Model of 5th Generation (DMR 5G) and the verified layer of waters, i.e. watercourse lines and water area polygons from the Czech Geodetic and Cadastral Office, as a basis.
The use of GIS has not left aside the web GIS technology in the CHMI. The ArcGIS Online product is used for publishing dynamic map outputs for the public and ArcGIS Enterprise, Standard version, was purchased for sharing GIS data within the CHMI.
ADMINISTRATION OF THE 4TH ORDER WATERSCHED DIVIDE DATASET
The watershed area is the basic and necessary source for the derivation of standard and non-standard hydrological data according to the Czech standard 75 1400 Surface water hydrological data. The watershed area is delimited by a watershed divide, which is an imaginary boundary separating two adjacent watersheds, or an orographically defined area from which water flows to the respective outlet section.
The first subdivision of watercourses according to hydrological sequence was made as part of the preparation of the Hydrological Conditions of the Czechoslovak Socialist Republic in 1965. Here, watercourses with their own developed beds and a watershed area greater than 5 km2 were singled out [2]. The hydrological subdivision is presented in the tabular summary of the publication and in the attached maps at a scale of 1 : 200,000 (see Fig. 1). The overview of the basic watershed areas also includes information on the name of the watercourse, its order, its length, shape of the watershed, forest cover and whether it is a left or right tributary. At that time, the hydrological order number was in the format of eight digits (1-22-33-444), which determined the watercourse´s affiliation to the European watershed divides (the Elbe, Danube, Vistula, Oder) and to more detailed sub-watersheds. This also defined the division of the hydrological arrangement of the watercourses into individual orders (i. e. first- to fourth-order watersheds).
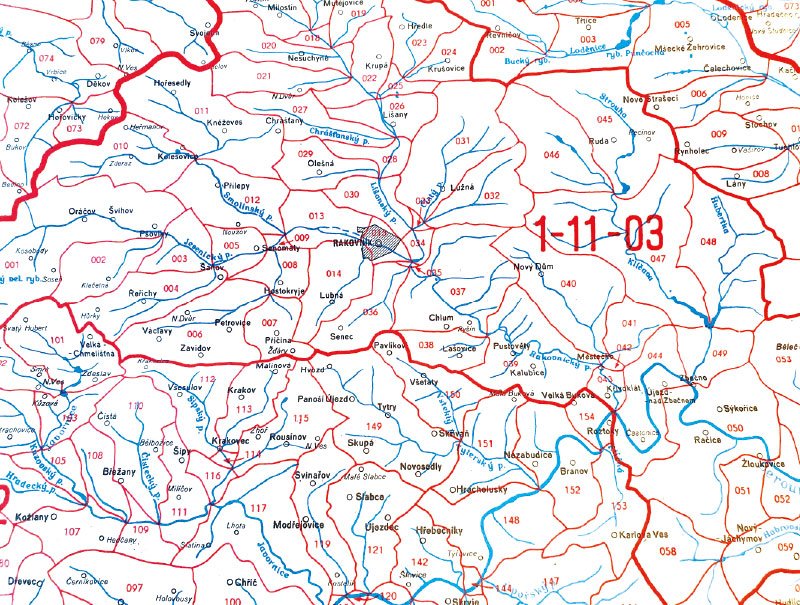
Fig. 1. Map of watershed divides in the book Hydrologické poměry [2]
Since then, there have been three major updates to the watershed divide dataset. First was the digitization of the 1 : 25,000 scale watershed divides from military topographic maps. At the same time, the hydrological arrangement number was expanded by one digit to nine positions (1-22-33-4444). The second update was carried out in 2008–2012, when the DIBAVOD (Digital Water Data Base) structure of watercourses was used for the 1 : 10,000 reference scale and the hydrological arrangement number was simultaneously extended to the current 14 digits (1-22-33-4444-5-66-77). This made it possible to structure the division of watersheds to the profiles of hydrological structures´ dams, out-of-level crossings and to the profiles of water gauging stations. The update was performed over an expanded set of fourth-order watersheds, from which the lower-order watershed divides are subsequently generated by the primary key, which is the hydrologic arrangement number.
The last update of the watershed divide dataset started after the completion of the DMR 5G and refinement of the watercourse layer based on aerial laser scanning at the Czech Geodetic and Cadastral Office in early 2018. The ESRI platform with all its components and database-desktop application-server links was used to update the watershed divides.
The actual editing/updating of the watershed divides is done through the ArcGIS Pro desktop application, Advanced license, at the hydrology departments of the CHMI branches and at the Surface Water Department of the CHMI central office. All necessary source data are stored in the Oracle database with ESRI SDE superstructure and shared via ArcGIS Enterprise. Its use through the SDE database or ArcGIS Enterprise ensures the up-to-dateness and consistency of data across the different processors. There is no need to split the watershed divide layer into individual parts based on the territorial scope of the branches and merge them back together after updating. The editing is done over one whole layer. Topological rules are set over the watershed divide dataset in the SDE database to ensure homogeneity of the edited data. Aerial photographs and the 1 : 10,000 base map provided as services of the Czech Geodetic and Cadastral Office´s ArcGIS Server are used, too. Binding work instructions have been created to ensure a uniform workflow for updating the fourth-order watershed divide dataset across branches. All data are converted and used in the WGS 1984 UTM 33N coordinate system.
The primary source for updating the fourth-order watershed divides is the Digital Relief Model Generation 5 (DMR 5G) of the Czech Geodetic and Cadastral Office with a 2 × 2 m raster resolution. Other necessary supporting sources include information on the structural and geometric layout of the watercourses. The geometry of the watercourses is taken from the data of ZABAGED state mapping work. The structure of the backbone watercourses is also determined by the ZABAGED watercourse dataset. The differences between the Central Watercourse Register dataset, which is used by watercourse administrators and the state enterprise Forests of the Czech Republic, and the ZABAGED watercourse layer are solved within harmonization of backbone watercourses covered by the “ISVS Water” project. The agreed changes are then incorporated into the ZABAGED watercourse dataset in approximately six-month cycles.
Other ZABAGED layers are indispensable sources, such as water areas, culverts or a point layer called “River network nodal point”, where information on crossings, confluences, springs, or pseudo-conjunctions (fictitious confluences or crossings) of watercourses are included in the attributes. At the same time, other data sources provided within harmonization of backbone watercourses covered by the “ISVS Water” project are used, especially foreign watercourses mediated by the Czech Geodetic and Cadastral Office and the Main Drainage Facilities dataset from the State Land Office.
In the territory of the Capital City of Prague, data on the storm sewer network and adjacent drainage areas of the Prague Water Management Authority and detailed data on watercourses managed by the Department of Environmental Protection of the Capital City of Prague are also used to update the watershed divides.
One of the main and most important bases for the creation of watershed divides are contour lines. Since contour lines derived from the DMR 5G from the Czech Geodetic and Cadastral Office are currently not available for the whole territory of the Czech Republic, the watershed divides are updated over contour lines generated “on the fly” with the same parameters at all branches using the raster tool “Contour” in ArcGIS Pro. This is de facto a raster layer that is redrawn dynamically according to the map scale. Based on the analyses, the basic scale for updating the watershed divides was set at 1 : 1,000 to match the accuracy of the digital relief model and, at the same time, to correspond to further processing of hydrological data. Nevertheless, when updating watershed divides in certain areas, editing at a higher resolution than the established scale is necessary.
The second necessary basis for updating the watershed divides is the shaded relief that is generated dynamically as well as the contour lines over the DMR 5G using the raster analysis “Hillshade”.
The Hydrologic Raster Analysis Toolkit uses the selected digital relief model to calculate and determine the hydrologic features of the watershed – including the river network and watershed divides. It is difficult to determine the correct course of watershed divides in some flat areas of the Czech Republic, so an extension in the form of a toolbox called HydroDEM was developed and incorporated into ArcGIS Pro by the Surface Water Depatment. This tool allows the automatic generation of watershed divides using DMR 5G raster analyses while defining boundary conditions (parameters and layers used). However, the automatically generated watershed divide is derived purely on top of the digital relief model and does not take into account anthropogenic interventions on watercourses, such as artificial flumes, off-channel crossings, underground sections or culverts that divert water under elevated roads. Therefore, the automatically generated watershed divide serves as an auxiliary tool in the actual updating of the watershed divide layer.
The process of updating the watershed divide dataset using DMR 5G is being funded under the institutional support for long-term conceptual development and will continue in 2022. The update is expected to be completed in late 2022. In the subsequent period, we expect to update the watershed divide dataset on an approximately annual cycle by incorporating changes related to changing watercourse structure impacting the watershed divide structure.
PREPARATION OF INPUT SOURCE DATA FOR DERIVATION OF M-DAY DISCHARGES
The M-day discharges, according to Czech standard 75 1400 Surface water hydrological data, are among the basic hydrological data provided for any river network profile. They are always determined for a specific reference period.
The calculation of the hydrological characteristics of the M-day discharges for the reference period 1981–2010 was preceded by the derivation of several climatological characteristics. The primary climatic factor that has the greatest influence on runoff patterns is precipitation. The long-term annual rainfall over a watershed is the amount of water from precipitation falling on the surface of a given area over a given time interval. It is expressed as the height of the water layer (in millimetres) distributed uniformly over the area.
The long-term annual rainfall over a watershed is one of the basic climatological and hydrological characteristics determining the long-term hydrological balance of the watershed. It can be determined using GIS tools by overlaying a polygon layer of watershed divides over a raster layer of rainfall derived from observations at rainfall gauging stations.
Therefore, deriving a raster of long-term annual precipitation using the maximum available data was one of the main objectives of the processing. The methodology for deriving the average annual rainfall for the reference period at the rainfall gauging stations is described in detail in reference [3].
The point data of long-term annual rainfall were interpolated to a raster layer using the orographic interpolation method developed at the CHMI [4]. A raster of terrain elevations at a 1 × 1 km step smoothed3 in the vicinity of 3 × 3 km was used as a basis. The advantages of the method used include the simplicity of use and the identification of regression relationships on a local (regional) level, while the disadvantage is the derivation of purely linear regression relationships where the magnitude of precipitation depends on only one variable. However, the use of smoothed terrain partially eliminates this disadvantage, because by smoothing the terrain, stations of the same elevation but representing completely different climatic conditions, e. g. Milešovka and Pec pod Sněžkou, are given different “relative” elevations due to average elevation change in relation to their surroundings.
A great contribution to the derivation of the raster layer of long-term annual rainfall was the use of data from foreign sources, which helped to refine the data in border areas, especially in the area of the Šumava and Krušné Mts., as well as in foreign territories where a significant part of Czech rivers´ watersheds lie (e. g. the Ohře, the Dyje).
By deriving the long-term annual rainfall together with the value of the long-term annual potential evapotranspiration, the so-called aridity index (see Fig. 2), which is the ratio of the annual potential evapotranspiration to the annual rainfall, can be calculated. This index is the basis for estimating the long-term runoff depth on unobserved watersheds.
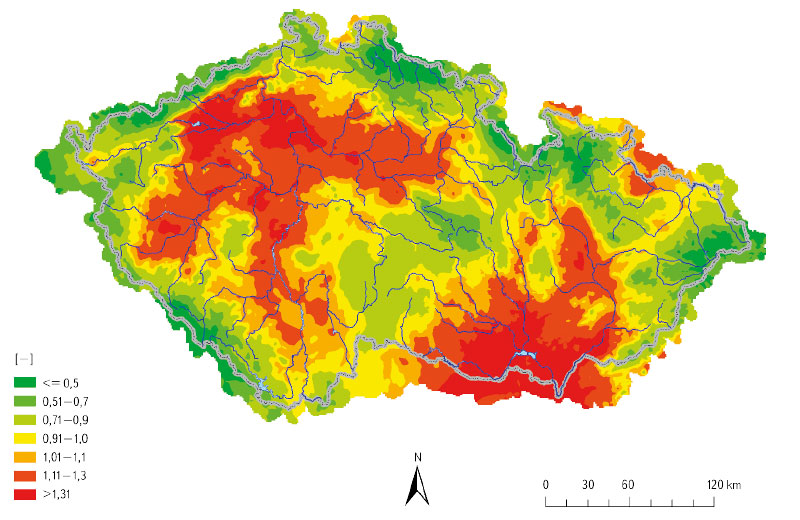
Fig. 2. Aridity index for the period 1981–2010
Data from 234 climatological stations with at least eight years of observation were used to derive the annual potential evapotranspiration raster for the period 1981–2010. First, monthly potential evapotranspiration values were calculated, and the annual sums were derived. The shorter series were complemented by means of the linear regression method using the analogue (stations with a complete series of observations) with the highest coefficient of determination.
Using orographic interpolation [4], a raster of annual potential evapotranspiration was derived for each year from the 1981–2010 period in a GIS environment and a raster of mean values for 1981–2010 was calculated.
The methodology for deriving the long-term annual runoff for the period 1981–2010 using regression relationships from the long-term average annual rainfall and long-term annual potential evapotranspiration is described in [3]. The derivation used map algebra functions applied to the above-mentioned raster layers of climatological features. The resulting map of long-term annual runoff depth is shown in Fig. 3.
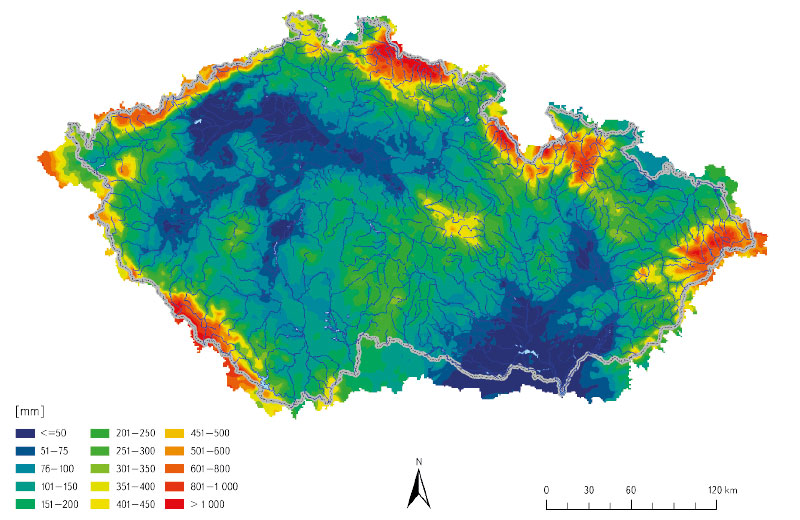
Fig. 3. Long-term annual runoff for the period 1981–2010 obtained from regression relationships between long-term average annual rainfall totals and long-term annual potential evapotranspiration
ELABORATION OF HYDROLOGICAL ASSESSMENTS
Hydrological assessments mean the provision of standard hydrological data according to Czech standard 75 1400 Surface water hydrological data. The standard hydrological data include, inter alia, the time series of hydrological variables observed at the gauging stations, the previously mentioned M-day discharges, N-year discharges and theoretical flood waves with peak flow rate of a given recurrence interval. Unlike the time series, the M-day and N-year discharge values and theoretical flood waves are provided for any river network profile. This fact, i. e., providing data for any river network profile, has led to the use of GIS technology to derive physical and geographic characteristics of the watershed and other variables that serve as the basis for determination of standard hydrological data in unobserved profiles.
The third generation of the application has been used for these purposes, successively called AVPosudek (for ArcView GIS 3.x), AGPosudek (for ArcGIS Desktop), and AGPosudek Pro (for ArcGIS Pro), with the functionality of each version of the applications being modified and developed as needed. The following description will cover the latest generation of this application, namely AGPosudek Pro.
AGPosudek Pro is an application in the form of an add-in for ArcGIS Pro developed in VB.NET using the ArcGIS Pro SDK for Microsoft.NET. Creating add-ins is facilitated by the integration of SDK into Microsoft Visual Studio and templates for the individual objects that make up the application (dialog windows and other controls). It is available at https://pro.arcgis.com/en/pro-app/latest/sdk/ (verified on November 5, 2021), including a large number of examples that are, however, written in C#. There is a C# converter for VB.NET, available at https://codeconverter.icsharpcode.net/ (verified on 5 November 2021).
Fig. 4 shows a cut-out of an ArcGIS Pro window with the AGPosudek Pro add-in loaded. The window shows a map with the watershed divide layer of the watershed under assessment for the profile shown by the point. It also shows detailed watershed divides of the basic watersheds, ZABAGED contour lines, and ZABAGED watercourses. A ribbon bar showing the various application tools is in Fig. 5.
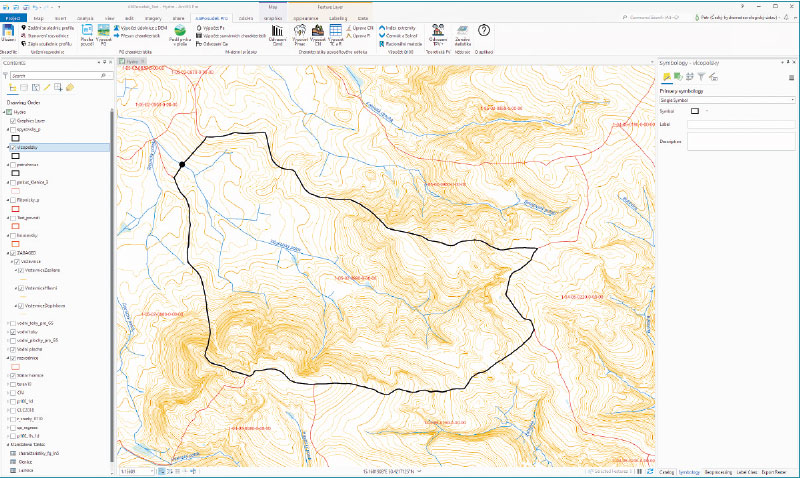
Fig. 4. ArcGIS Pro window with a map showing the watershed, contour lines and watercourses being assessed

Fig. 5. AGPosudek Pro application ribbon bar
The creation of a full version of the ArcGIS Pro application was only possible in version 2.6, which enabled the incorporation of user graphics (points, lines and polygons) into the map graphics layer.
The functionality of AGPosudek Pro can be briefly summarised as follows:
Saving the selected watershed polygon: the user selects from the basic watershed divides layer a watershed polygon in which to process the assessment and saves it in a separate shapefile.
- Determination of the watershed divide: Based on the coordinates (usually in S-JTSK), the user plots a profile on the watercourse as a point on the map in the graphics layer and plots the line of the watershed divide that passes through the point in the graphics layer. Then, using the “Determine watershed divide” tool, the user splits the polygon in the shapefile of the selected watershed. The user can delete the downstream part of the watershed (below the profile) and continue working only with the polygon of the watershed to the profile under consideration. All results of the tools below are written in the attribute table of the selected watershed layer.
- Calculation of the watershed area: The watershed polygon area is recalculated from the map projection to the ETRS89 / LAEA Europe planar projection (code 3035).
- Calculation of physical-geographical characteristics: The tool calculates the average slope of the watershed based on the selected DMR layer and, if the thalweg line is plotted, it also calculates its length and slope. The tool uses the GIS function “Slope” inter alia.
- Deriving the thalweg line from the DMR: Based on the selected DMR layer, a line is derived that connects the outlet section and the hydraulically furthest point in the watershed. The tool uses the GIS hydrological functions (Flow Direction, Flow Accumulation, Flow Length, etc.) and the CostPath function, see Fig. 64. The length and slope of the thalweg are also calculated. In addition to an attribute table, the results are displayed in dialogue windows from where the user can copy them into any document.
- Calculation of the feature´s share in the area: Based on the Corine Land Cover layer, the tool calculates the proportion of the area of the selected land cover to the watershed total area. It is most used to calculate the proportion of the area covered by forests. The tool uses the GIS function “Tabulate Area”.
- The application also uses the zonal statistics function based on the selected raster layer, e.g. to calculate average values per a watershed. These are the average long-term annual rainfall, the N-year maximum rainfall of a given duration, the CN value, etc.
- Other functions of the application are used to derive specific hydrological characteristics, e.g. 100-year flow values, using various methods. For this purpose, the results of the previous tools are used to derive physical-geographical characteristics, average N-year rainfall values, CN values, forest cover ratio, etc.
The AGPosudek and the new AGPosudek Pro applications are used by hydrologists preparing assessments at the CHMI branch offices.
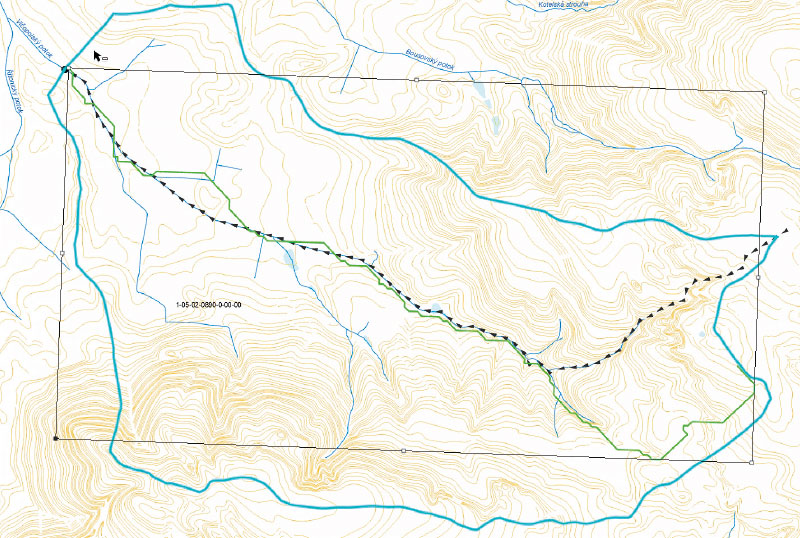
Fig. 6. Hand-drawn (black arrows) and calculation-derived (green line) thalweg
FLASH FLOOD INDICATOR
The operational hydrological service, called the Flood Forecasting Service, issues important outputs for the public. They are available on the website https://hydro.chmi.cz/hpps/ (verified on 7 November 2021).
A flood event that is both potentially dangerous and difficult to predict is flash flooding. It is not possible to accurately predict both the time and place of occurrence of a flash flood because the location and time of the causative factor, which is torrential rainfall, are difficult to predict. Despite these difficulties, it is possible to monitor and evaluate in real time certain parameters and phenomena from which the level of risk of flash flooding occurrence or localised flooding can be assessed.
One of these phenomena is the level of current soil saturation. If the soil is more saturated, it can hold less water and its infiltration capacity is reduced. Therefore, in areas with higher soil saturation, the risk of flash flooding in the event of torrential rainfall is significantly higher. Using rainfall-runoff modelling, it is possible to determine the approximate amount of rainfall that, if it fell over a certain period, would potentially cause significant surface runoff.
Torrential rainfall is one of the potentially dangerous concomitants of convective storms. The occurrence of convective storms in time and space is monitored by weather radars. The radar does not directly measure rainfall, but reflectivity. Based on the relationship between the reflectivity and the hourly rainfall intensity, it is possible to estimate approximately how much rainfall has fallen or will possibly fall over an area based on a short-term forecast, called nowcasting [5]. Precipitation estimates can be refined significantly using a combination of rainfall observations and radar measurements. By means of rainfall-runoff modelling, it is then possible to approximate the magnitude of the runoff response and therefore the risk of flash flood occurrence.
Based on the above-mentioned facts, the development of the so-called Flash Flood Indicator (FFI), which started within the R&D project SP/1c4/16/07 “Research and implementation of new tools for flood and runoff forecasting within providing the flood forecasting service in the Czech Republic” (2007–2011), was inspired by the “Flash Flood Guidance” system operated by the U. S. National Weather Service (NWS) [6].
The FFI system was in experimental operation until 2016 and was gradually improved. The outputs for the period 2017–2019 were evaluated in detail, and since 2020 the FFI has been part of the CHMI forecast service. The system is in operation from approximately mid-April to mid-October, which is the period with convective precipitation. It is described in detail in paper [7], and a translation of this paper into English has now been completed (November 2021), together with a major update of its content [8].
Development of FFI began on the ArcView GIS 3.x platform in the Avenue programming language and was transferred to ArcGIS Desktop system and reprogrammed in Python during 2011. Individual tools can be run interactively (from within the GIS environment) or automatically using the system task scheduler, either in a daily step or in a defined shorter step.
Configuration files containing many parameters are available to configure the running of the procedures. It is possible to specify input data paths, directories, or geodatabases for storing the results, time step interval of input rainfall data in minutes, length of time in minutes for both rainfall and nowcasting, threshold values for determining individual risk levels, etc.
The following data are the basic input in the daily step:
- A raster of 24-hour rainfall totals as a combination of radar measurements and rainfall observations, called MERGE, see [9].
- Point values of the current evapotranspiration, which are interpolated by the IDW (Inverse Distance Weighing) method into the raster.
The output of the procedures in the daily step is:
- A raster of current soil saturation values represented by CN values at 1 × 1 km resolution, derived from the balance of rainfall and evapotranspiration. The saturation indicator is defined by relating the current CN values to the extreme (limiting) CN values.
- Polygon layer with the potentially hazardous precipitation totals of 1-, 3- and 6-hours duration for a 3 × 3 km area.
The calculations in daily step are run several times during the day, leaving room for sometimes necessary adjustments of the input data and recalculation of the outputs.
The main input to the procedures, which are run in a shorter time step (every 20 minutes in 2021), are 15-minute sums of radar precipitation estimates that are adjusted based on rain-gauge observations. Until 2021, a single value of the adjustment coefficient was derived for the whole territory of the Czech Republic. Since 2022 onwards, it is expected to use an area-varying adjustment coefficient and to use the MERGE product at time intervals when this product is already available. The modification of the adjustment coefficient calculation method was addressed within the research project VI20192021166 “Hydrometeorological risks in the Czech Republic – changes in risks and improvement of their prediction” (2019–2021) and is described in detail in the article [10].
The risk of flash flood occurrence is calculated in a network of hydrologically connected watershed features and river reaches, in which the basic source layer is a polygon layer of the basic watersheds, where physical and geographic characteristics (watershed slope, thalweg slope and length, current CN value, etc.) are calculated for each watershed. These linked features form a hydrological model in which the hydrological response to actual rainfall is calculated, as well as to expected rainfall, which is predicted by nowcasting. The risk of flash flood occurrence is calculated in the outlet section of each watershed.
In the 3 × 3 km polygon layer, the local flooding risk is calculated based on the two-hour sum of the precipitation that has already fallen, or the one-hour sum of the precipitation that has fallen and the one-hour sum of the precipitation from nowcasting. Physical and geographic characteristics including the current CN value are derived for each polygon, like all watersheds.
A total of three thresholds, which are linked to the theoretical value of the specific 100-year flow, are set for the flash flood risk calculated in the hydrological model of the linked watersheds and river reaches, as well as for the local flood risk determined for polygons of constant size. These threshold values can be changed in configuration files.
The main result is the determination of the risk of flash flooding and local flooding for the municipalities with extended jurisdiction, for which the so-called general risk of flash flooding is also determined according to the following Tab. 1.
Tab. 1. Matrix for the derivation of the general risk for the municipalities with extended jurisdiction according to the flash flood risk and the local flooding risk

For the purposes of Flood Forecasting Service, an XML file with information on the risk of flash flood or local flooding is generated for each municipality with extended jurisdiction and this output is also used in the mobile application of the Czech Hydrometeorological Institute.
All outputs are also stored in ESRI file geodatabases in the form of raster and vector layers or tables. Selected data are transferred to cloud storage on ArcGIS Online and displayed as web maps and interactive web applications.
The following two images show the web maps that are embedded in the Flood Reporting and Forecast Service site. Fig. 7 shows the saturation indicator, and Fig. 8 shows the totals of potentially hazardous rainfall lasting 3 hours. Both maps are fully interactive.
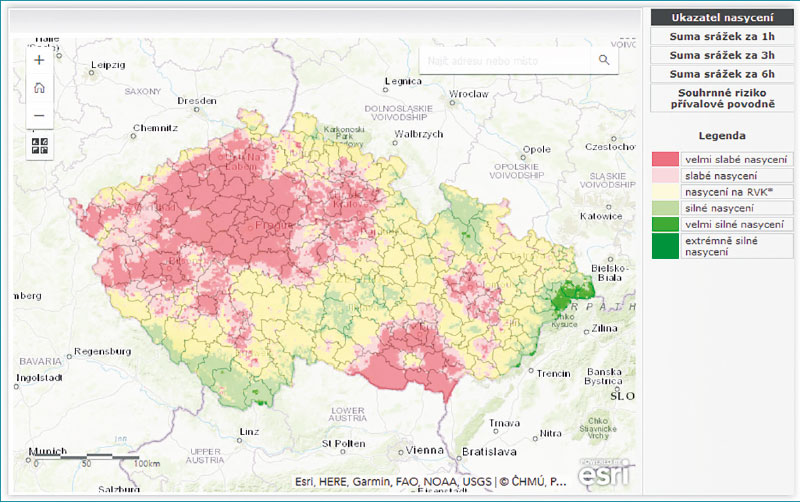
Fig. 7. Soil saturation indicator valid for June 30, 2020 at 6:00 UTC as seen on the CHMI website, see legend in Tab. 2
Tab. 2. Legend of the soil saturation layer
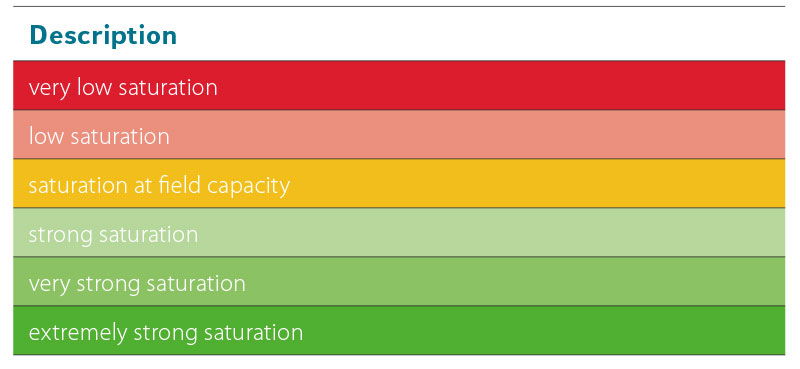
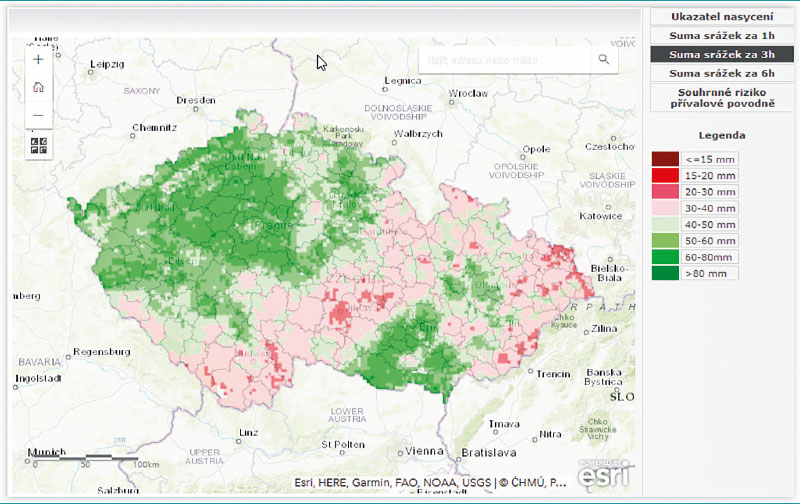
Fig. 8. Map of potential risk rainfall amounts with the duration of 3 hours valid for June 30, 2020 at 6:00 UTC as seen on the CHMI website
Fig. 9 shows the window of the web mapping application where all relevant and up-to-date outputs from the FFI system can be viewed:
- saturation indicator,
- potentially risky rainfall events with durations of 1, 3 and 6 hours,
- risk of local flooding for municipality with extended powers,
- risk of flash floods for municipality with extended powers,
- the general risk of flash flooding as a combination of the risks of local flooding and flash flood (see above),
- the sum of the adjusted radar estimates of rainfall in 3 × 3 km polygons over the previous 2 hours, if the sum was higher than 10 mm or this sum posed a risk of local flooding,
- the sum of the adjusted radar estimates of rainfall in 3 × 3 km polygons over the previous 1 hour plus 1 hour of nowcasting if the sum was higher than 10 mm or this sum posed a risk of local flooding,
- the risk of flash floods in a watershed system where a filter can be applied for those watersheds where peak flow is yet to be reached.
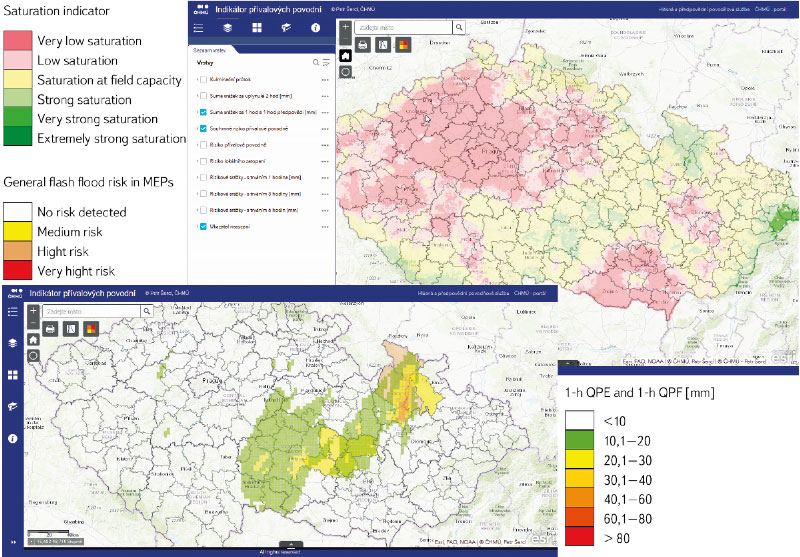
Fig. 9. The outputs from web map application ‘Flash Flood Indicator’ running on the ArcGIS Online platform. It depicts the soil saturation indicator layer (upper-right), radar rainfall estimates (QPE and QPF) ≥ 10 mm/2 h and actual general flash flood risk (bottom left) in municipalities with extended jurisdiction
The application currently runs on ArcGIS Online in two versions. The older one is based on the Web Application Builder template, the newer one is based on the Experience Builder template, which has more advanced options in relation to optimizing the view for different devices (PC, tablets, mobile phones).
The Flash Flood Indicator is a comprehensive system based on the ESRI GIS technology platform. It consists of quite extensive Python scripts that make use of many GIS functions ranging from interpolations, map algebra and advanced geoprocessing functions (overlays or intersections of layers) to publishing data layers in a web environment. In particular, the “arcpy” library, which is licensed with ArcGIS Desktop or ArcGIS Pro products, and the “arcgis” library, which is a freely available library for working with GIS layers published on the web, are used.
CONCLUSION
Presenting specific examples, this paper demonstrates the use of GIS technology in solving various hydrological tasks at the Czech Hydrometeorological Institute. It is clear that GIS has long been used not only to create cartograms or carto-diagrams, but it is a comprehensive tool that includes the creation and administration of data in multi-user geodatabases, geospatial data processing and analysis, the possibility of creating user-tailored applications or creating scripts to solve complex tasks.
Although the focus of work in GIS is likely to remain on working with data in a heavy client environment, the publication of results is shifting from static maps to dynamic maps and online map applications that can be accessed from a standard web browser. This will allow to extend the use of GIS technology to users who do not normally work with GIS technology, and it is also an opportunity for organisations (in this case the CHMI) to effectively publish data and results of their employees’ work.
The paper has been peer-reviewed.
Notes
- At present it is The Military Geographic and Hydrometeorological Office in Dobruška
- This includes fourth-order watersheds and watersheds related to other important profiles (reservoir dams, water gauging stations, etc.)
- The “Aggregate” function was used to calculate the average values of the original 100 × 100 m raster at 1 × 1 km resolution, and then the “Block Statistics” function was applied to create a raster of average values over a 3 × 3 km radius while maintaining the 1 × 1 km raster resolution.
- The differences between the automatically derived thalweg and the thalweg determined “manually” are due both to the distinction of the basis DMR and the choice made by the user-hydrologist, who usually respects the actual course of the watercourse line when determining the thalweg.
