FROM HISTORY TO THE PRESENT
Geographic information systems (GIS), data processing, evaluation and interpretation are an essential and integral part of research at present as most information can be related to a specific location on the Earth’s surface. The GIS and Cartography Department at the T. G. Masaryk Water Research Institute deals with research and commercial projects by means of the application of GIS tools. However, it is not just a matter of using specialised software; valid data and qualified staff who can apply their knowledge correctly are also essential. The GIS and Cartography Department has been working at the Institute for many years. In the 1990s, there was a cartography and remote sensing unit, which was part of the Water Management Department. The unit provided not only mapping source documents and data for the state administration (these activities are being carried out within the project “Support for the state administration in the field of water” after the transformation into a public research institution), but also the updating and printing of the Base Water Management Map 1 : 50 000. As part of its research activities, the Department later participated in the projects “Evaluation of the flood situation in July 1997” within the subtask “Geodetic documentation for flood evaluation and the creation of a digital model of the river system in the affected areas” and “Integration of the information on landfills, facilities and old contaminated sites, evaluation of their environmental risks and impacts” [1]. The need for quality and accessible data resulted in the creation of the Digital Water Management Data Base (DIBAVOD) as a source of geodata for water management and protection [2]. Subsequently, the staff of the Department participated in the research project, specifically in its sub-part “Development and application of procedures using geographic information systems technologies in relation to the Digital Water Management Data Base”. At present, the activities of the GIS and Cartography Department are very diverse. It deals with national and international research projects, administers and updates data for the government, develops online mapping applications, analytical tools, and procedures. It also prepares cartographic outputs and cooperates with all the other departments within the T. G. Masaryk Water Research Institute, for which it also administers the data warehouse and GIS devices. Last but not least, it provides expertise in the field of geographic information systems and cartography. And despite this wide range of activities, the Department tries to keep up with the fast-developing trends in GIS, which it then puts into practice.
TASTING OF OUR ACTIVITIES
Base Water Management Map of the Czech Republic
This unique cartographic work, the Base Water Management Map of the Czech Republic at the scale of 1 : 50 000, is the most detailed national water management map. It was prepared as a part of the Directional Water Management Plan and published by the Czech Geodetic and Cadastral Office as a thematic national map for the Ministry of Environment of the Czech Republic. The T. G. Masaryk Water Research Institute is in charge of the thematic content and its updating. The territory of the Czech Republic is covered by 211 map sheets in the arrangement of medium-scale base maps.
The first systematic subject-focused mapping in water management for the Czech Republic´s territory was done within the State Water Management Plan of Czechoslovakia (1st edition of the Plan) in 1949–1954. The beginnings of the development of the Base Water Management Map date back to 1961, when the Ministry of Agriculture, Forestry and Water Management commissioned the Water Management Directorates in Prague and Bratislava, in cooperation with other water management organisations, to draw up the “Base Water Management Map of the Czechoslovak Socialist Republic” (1964 edition). In 1971–1976, a new set of the Base Water Management Map of the Czechoslovak Socialist Republic was prepared again in terms of authorship, cartography, and reproduction on the basis of the Base Map of the Czechoslovak Socialist Republic (1 : 50 000). This set is referred to as the 1st edition in the history of the creation and updating of the Base Water Management Map (1 : 50 000). The second updated edition of the Base Water Management Map of the Czechoslovak Socialist Republic was published in 1980–1988. The last, third updated edition of the Base Water Management Map of the Czech Republic was published in 1989-1999. Since 1999, further development of the Base Water Management Map has been directed towards the transformation of the analogue map into a digital map in the form of the DIBAVOD geographic reference database. The process of digitisation of the Base Water Management Map (1 : 50 000) was carried out in the T. G. Masaryk Water Research Institute by vectorising objects from scanned sheets of the Base Water Management Map (1 : 50 000). Since 1995, the base map (1 : 10 000) has been digitised by the Czech Geodetic and Cadastral Office in the same way into layers of the Basic Geographic Data Base (ZABAGED®) [3]. The updated course of watercourses and catchment divides was obtained on a sheet-by-sheet basis from ZABAGED®. The watercourses and catchment divides were gradually processed topologically into the form of a structural model of the Czech Republic´s catchments and watercourses. The layers of watercourses and catchment divides were then incorporated into DIBAVOD, which was subsequently the source of the thematic content of the updated edition of the Base Water Management Map (1 : 50 000) [4].
Eight test sheets were issued in 2008. The catalogue of map symbols was revised, and the legend became part of the map sheet (Fig. 1). Due to the lack of funding and the different responsibilities for the thematic layers, merely the printing technology line was set up and tested in cooperation with the Czech Geodetic and Cadastral Office in Sedlčany.
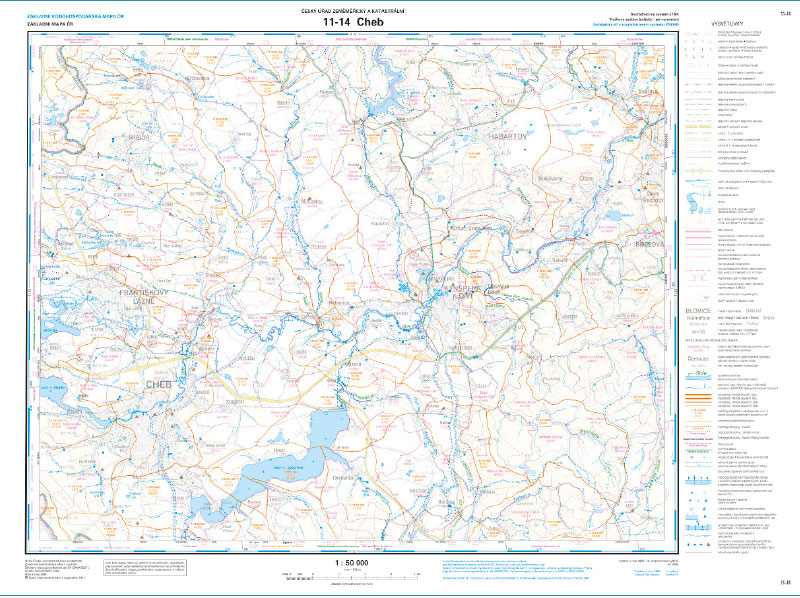
Fig. 1. Test sheet of the Base Water Management Map (1 : 50 000)
The original printed Base Water Management Map (1 : 50 000) is currently distributed only in the digital raster form created by scanning the original printed maps (TIFF format with LZW compression, 400 DPI resolution). More information is available at https://www.dibavod.cz/63/puvodni-tistena-zakladni-vodohospodarska-mapa-1:50-000.html
Digital Water Management Data Base
The need for a unified spatial data base for water management and water protection led to the development of a major database, known as DIBAVOD, namely as a thematic extension of ZABAGED®. It is intended, inter alia, for the creation of thematic cartographic outputs focused on water management and water protection on top of the Base Map of the Czech Republic 1 : 10 000 or 1 : 50 000. The first mention of DIBAVOD appeared within the R&D project 650/8/01 “Methodology for creating cartographic outputs from digital data”. In pursuance of this project, the DIBAVOD Object Catalogue was defined, which consists of a list of object types in the category of water and a set of catalogue sheets, each of which being dedicated to one object type. A draft document “Instructions for the creation, updating and publishing of the Water Management Map of the Czech Republic 1 : 50 000” with a catalogue of the Base Water Management Map (1 : 50 000) symbols and a sample sheet (15–32) were created inter alia. A similar material has been created for the Map of Flood-Prone Areas: “Instructions for the creation, updating and publication of the Map of Flood-Prone Areas in the Czech Republic 1 : 10 000” with the catalogue of map symbols of the Map of Flood-Prone Areas (1 : 10 000) and the sample sheet for the Map of Flood-Prone Areas (1 : 10 000) (15-32-20). The technological solution was appropriate for its time – it was an Intergraph MGE environment. The aim was to keep all defined objects (datasets) up-to-date and freely available to the public if possible. This goal could not be achieved because several ministries and some private sector entities are responsible for the data at the same time. Stable funding for updating the database in its entirety is not guaranteed at present. For these reasons, some objects are inaccessible, and some have not been updated for a long time. Nevertheless, it can be hoped that the situation will change, and that all data will be up-to-date, guaranteed and available to all and that the production of the cartographic visualisation of the Base Water Management Map (1 : 50 000) will be resumed.
Data not only for state administration
As mentioned above, quality and guaranteed data are the cornerstone of any successful and responsible research activity. The same applies to the performance of government and other related agendas. The GIS and Cartography Department and the entire T. G. Masaryk Water Research Institute are proud partners involved in the administration, updating and publication of selected spatial data used by the state and public administration. A small taste of the data and activities is given in the following paragraphs.
The watercourse data set is one of the core data sets in water protection and water management. It is therefore vital that these data are kept neat and in the best accordance with reality. As the agendas related to watercourses are divided among several actors from different ministries, several different watercourse data sets have been created over the years. To correct this inconsistency, a cross-ministerial working group has been established to address “harmonisation of the river network in the Czech Republic” since 2019. In cooperation with the Ministry of Environment (T. G. Masaryk Water Research Institute, Czech Hydrometeorological Institute), Ministry of Agriculture (catchment administration enterprises (Povodí), Forests of the Czech Republic, State Land Office) and the Czech Geodetic and Cadastral Office, the springs, estuaries and possibly the course of the main watercourses in all more than nine thousand 4th order river catchments are being checked. The result should be a single guaranteed network of watercourses, which will have an agreed structure, contain all relevant information and, where appropriate, be linkable with thematic databases of stakeholders via linking identifiers. This data set should be administered by the Czech Geodetic and Cadastral Office within ZABAGED® as a unified source of information.
Another important activity is updating the database of water resource protection areas in the Czech Republic, which the GIS and Cartography Department has been working on with several breaks for about 20 years. A comprehensive revision of the database was carried out within the project “Support for State Administration Performance” under the Ministry of Environment in 2015–2017. The database now contains more than 17,000 polygons of protection areas. Almost 15,000 of them have been validated by the competent water administration authority of the respective municipality and are accompanied by the document on the establishment of the water resource protection area in digital form. The remaining 2,000 areas are either no longer valid or have not been verified by the relevant authority. Currently, updating work is being carried out at annual intervals [5]. A user-friendly online mapping application has been developed, available at https://www.dibavod.cz/ochranna-pasma (Fig. 2), to make visualisation of the water resource protection area database easier. At the turn of the year, the database is always published and available for viewing and downloading via web services on the DIBAVOD and HEIS portals [6] and on the National INSPIRE geoportal [7].
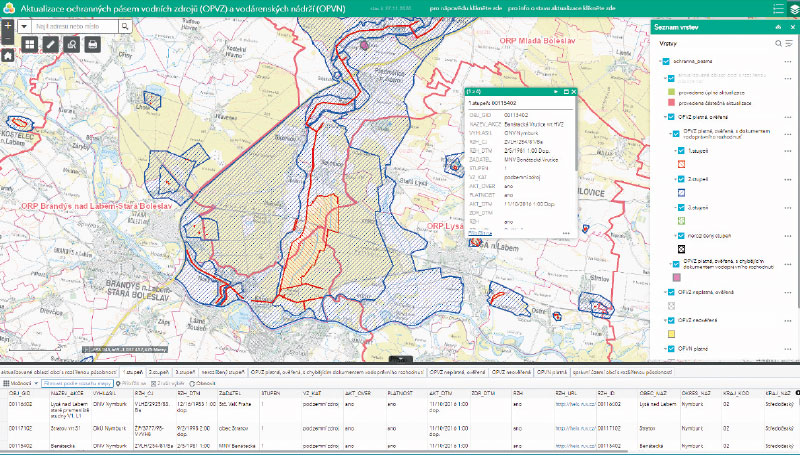
Fig. 2. Web map application showing the current status of the water resource protection area
INSPIRE is a European directive that simplifies the way spatial data should look, how they should be described and how they should be shared so that they are usable by all users [8]. Although European directives may not always be popular, it is at least an interesting challenge to create uniform data models across European countries so that all users understand and can share, compare, and harmonise the data with each other. The Directive is therefore a good first step in this endeavour. The T. G. Masaryk Water Research Institute is responsible for several data sets that are subject to this Directive. Metadata are thus provided for these data and users can view or download them using web mapping services.
The T. G. Masaryk Water Research Institute is also a key player in international cooperation concerning water protection and it puts great emphasis on correct and harmonised data being collected, updated, and shared with domestic and international users. The Institute is also an important partner for foreign entities, not only in activities related to spatial data. One of the main partners, as mentioned above, is the European Commission and its organisations to which spatial data and information are reported according to the relevant European directives [9–12]. Other important partners are the International Commissions for the Protection of the Elbe, Danube and Oder rivers [13–15]. The Institute collaborates with these Commissions and its partners in the development of strategic key documents and shares with them mutually relevant data related to water management and protection.
Use of remote sensing methods to monitor bathing sites in the Czech Republic
The project TJ02000091 “The use of remote sensing methods to monitor bathing sites in the Czech Republic” was implemented in the period 2019–2021. It was funded by the Czech Technology Agency, specifically from the Zeta II programme for the support of junior researchers in innovative activities. The primary objective of the project was to find a relevant relationship between the values of selected indicators of bathing water status and quality which resulted from field surveys and subsequent laboratory work on one hand, and the values from the processed Copernicus (Sentinel-2) satellite data on the other. Using GIS tools and modern statistical techniques, six predictive models were constructed and applied to 40 selected bathing water sites (Fig. 3). The project´s most important outputs include the online map application “Indicators of the state and quality of bathing waters in the Czech Republic” and the printed publication “Atlas of bathing waters in the Czech Republic”. Information on the achieved results and the project´s other parameters is presented on the website https://www.dibavod.cz/201/vyuziti-metod-dalkoveho-pruzkumu-zeme-pro-monitoring-stavu-a-kvality-koupacich-mist-v-ceske-republice.html. The results and findings obtained within the project confirmed the initial hypothesis that satellite data can support and improve existing monitoring significantly [16].
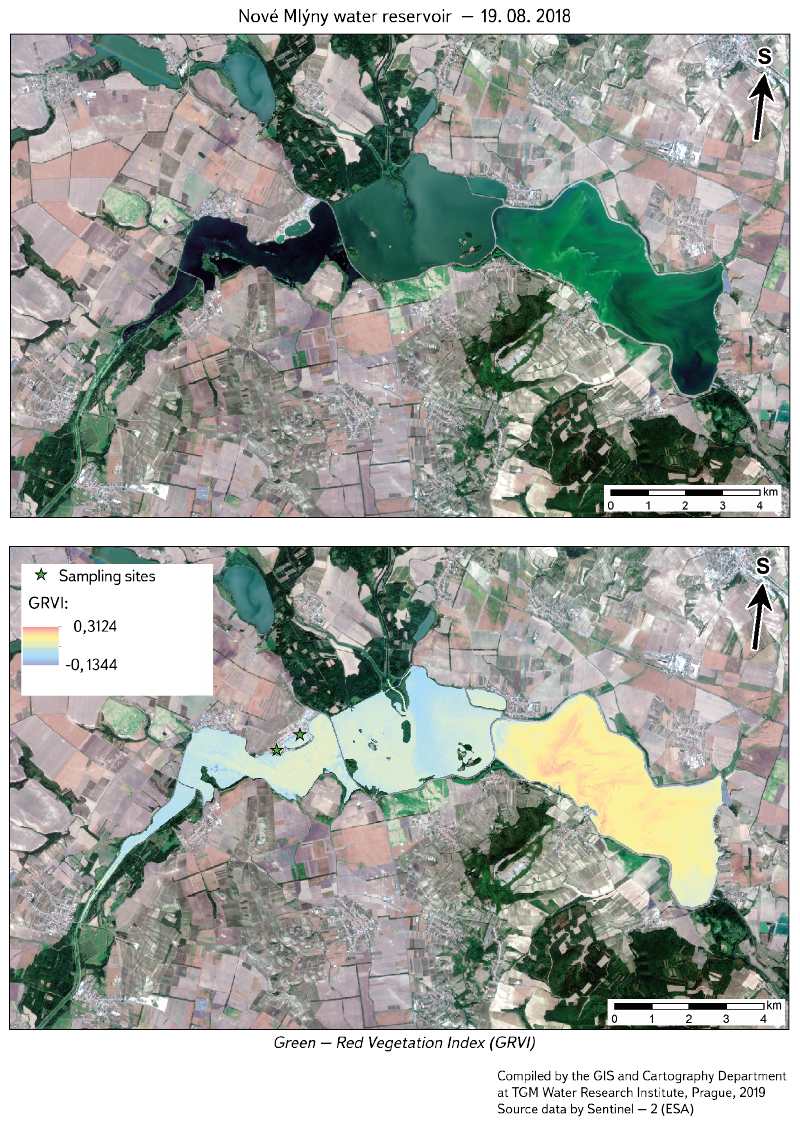
Fig. 3. Example of remote sensing data evaluation
Research using altimetry data
In the past, the GIS and Cartography Department worked on several important projects using the then new product 5th-Generation Digital Model of the Czech Republic´s Relief (DMR 5G) [17]. It concerned very detailed data acquired by the Czech Geodetic and Cadastral Office in cooperation with other organisations using the airborne laser scanning. Within the research project VZ 0002071101, the then new detailed relief model was used to identify transverse obstacles in the beds of small watercourses and to revise the data sets of catchment boundaries and watercourses. The Ministry of Interior’s security research VG20102014010 enabled testing of the modern RS 5G technology in relation to flood-prone areas delimitation accuracy in 2010-2014 (Fig. 4).
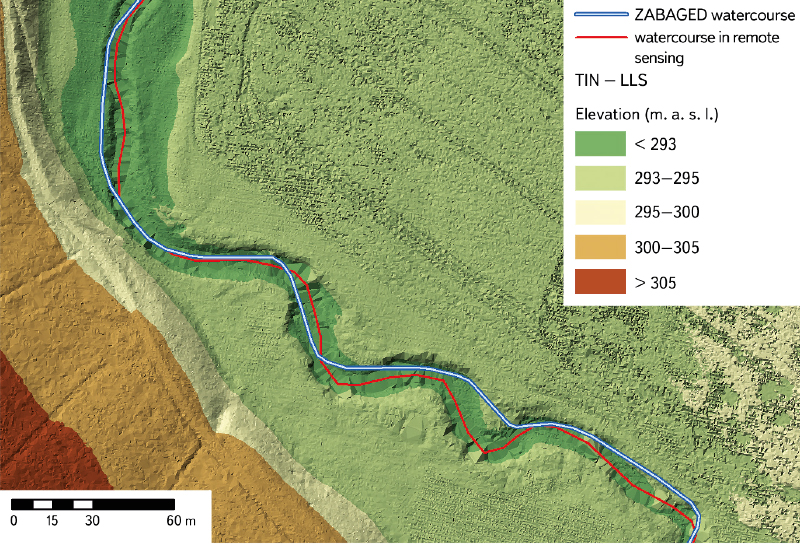
Fig. 4. Testing the use of RS 5G in the context of water management and water protection
Type-based drought mitigation measures – online mapping application
The online mapping application Type-based Drought Mitigation Measures was developed to make information available to the public on how to address adaptation of an area of interest to ongoing climate change and associated increased drought events. It is available at https://www.dibavod.cz/typova-opatreni-sucho (Fig. 5). Possible solutions are presented by means of selected sample sites where some measures to mitigate the negative impacts of drought have been implemented. The specific measures themselves can be viewed, as well as the whole set of taken measures, including a description of the expected impact on drought via a fact sheet. The application is based on a combination of the R programming language (including extension packages) and HTML 5, CSS and Javascript technologies. The application includes a clear help and a detailed user manual.
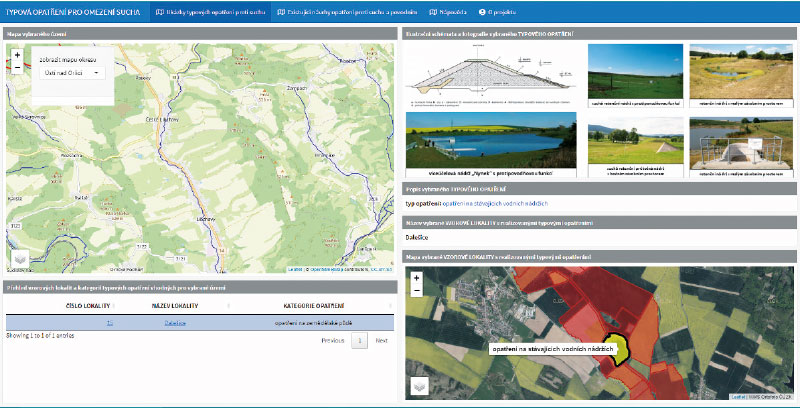
Fig. 5. Online mapping application Type-based Drought Mitigation Measures
Growth pole I and II
A survey of potential opportunities to expand bathing and water recreation sites in the Capital City of Prague was carried out within the project “Water Recreation Opportunities in the Capital City of Prague (from History to the Present), Prague – Growth Pole II” in 2018–2020. Water quality was monitored, and the condition and potential were assessed in 57 sites selected out of approximately 150 sites found. The main outputs of the project were a database, a set of maps (https://koupanivpraze.vuv.cz/) and an online map application (https://www.dibavod.cz/vodni-rekreace-praha), which present the project results in a clear way and increase public awareness of the current opportunities for recreation by water in the Prague area (Fig. 6) [18].
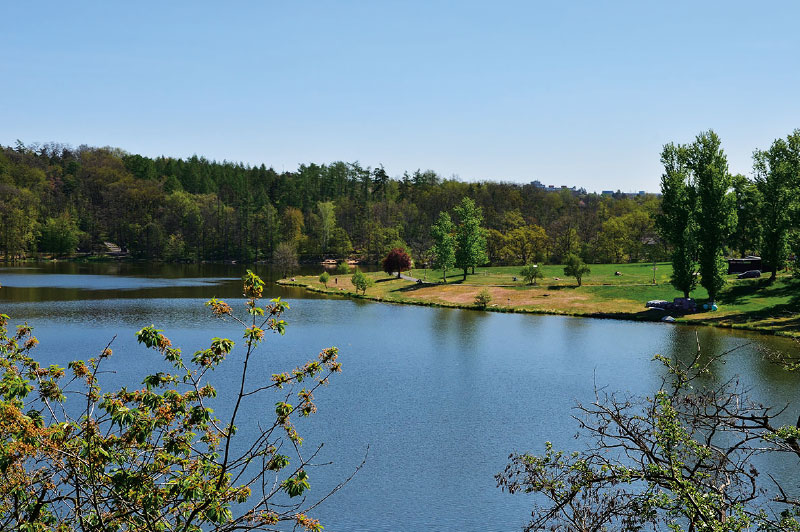
Fig. 6. Example of a bathing place
Sustainable recycling of plastics in Mongolia
The project aims at contributing to economic prosperity and poverty reduction as well as supporting the development of a green economy and the transition to a low-carbon, resource-efficient and circular economy in Mongolia. Waste management is a key issue in Mongolia due to urbanization, industrialization, and the increasing consumption of packaged products. Plastic waste is a particularly serious problem as it causes extensive pollution and is also often dumped illegally by both citizens and companies. The project, funded by the European Union (SWITCH-Asia Programme), is led by The Charity of the Czech Republic. The T. G. Masaryk Water Research Institute, together with three other partners, is a co-operating institution. Experts from the Waste Management Centre are the main researchers within the Institute. The GIS and Cartography Department is mainly responsible for data analysis and publication of results using cartographic outputs and online mapping applications [19].
WHAT (ELSE) CAN THE GIS AND CARTOGRAPHY DEPARTMENT DO FOR YOU?
Remote Sensing
The popularity of satellite data, i.e. the results of unconventional remote sensing methods, is currently on the rise. The reason for this growing interest is caused not only by their distinctive characteristics, but especially by the fact that recently some satellite system operators have released their data in open-source mode, i.e., for free use. It should be noted here that, thanks to the very high frequency and large extent of sensing of the Earth’s surface, it is easy to create relatively dense time series and thus build up a relatively complete picture of the evolution of the object or phenomenon under observation. For this reason, satellite data are generally considered a tool that is suitable for increasing efficiency but also for reducing the cost of certain activities. The relevance of the results obtained from remote sensing data is ensured by the necessary calibration and subsequent validation with terrestrial data (obtained in situ). Since 2018, the GIS and Cartography Department has been testing specific tasks with European Space Agency (ESA) optical data, both at low spatial resolution (Sentinel-3) and at very high spatial resolution (Sentinel-2). Attention is also given to data acquired in the thermal band of the electromagnetic spectrum (Landsat 7, 8 and the TERRA satellite system). Radar data (Sentinel-1) should not be overlooked either. Specific applications we address include e.g., monitoring of some indicators of bathing water status and quality, snow cover detection, soil moisture monitoring, determination of landscape surface temperature and water levels.
Cartographic outputs
Map works or overview maps (Fig. 7) are the outputs of many research and commercial projects. The GIS and Cartography Department ensures that the map output is of a standard that meets basic cartographic rules, is easy to understand and presents project results appropriately. In addition to “classic” analogue maps, it also deals with online cartography.
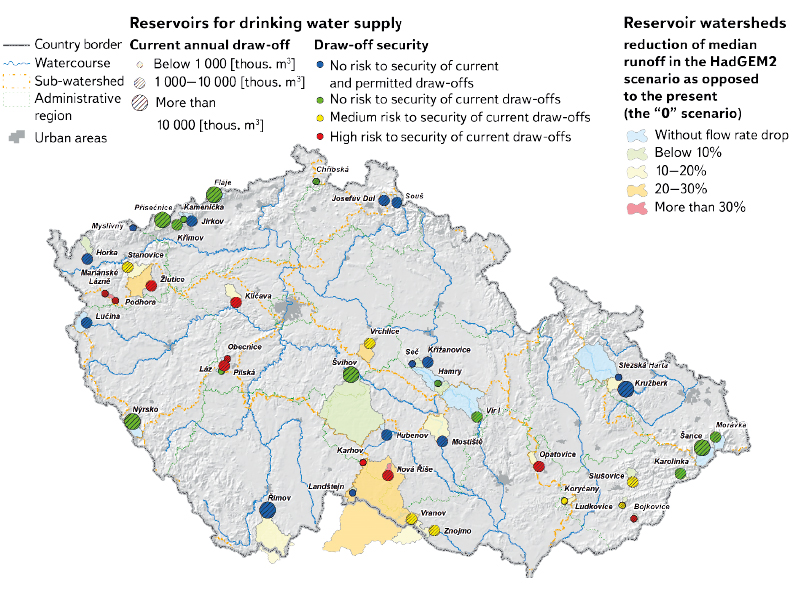
Fig. 7. Illustration of the map output
Online map applications
The online map application is a well-arranged interactive tool for publishing data and services with on-line access via a web browser. It is an integral part of modern sharing of individual project outputs with the general public or stakeholders. It can contain raster and vector datasets (lines, points, polygons) with an attribute table supplemented by additional information (e.g., photo, graph, animation, website). Analytical and publishing tools can also be used within the application. Some links to online map applications developed at the T. G. Masaryk Water Research Institute have been provided in the text of this article. Here are a few more:
- Water Recreation Opportunities in the City of Prague (from History to the Present) (https://www.dibavod.cz/vodni-rekreace-praha)
- Indicators of the status and quality of selected bathing waters of the Czech Republic (https://geoportal.vuv.cz/aplikace/dpz-koupaci-vody-zeta/)
- Water recreation – bathing in natural swimming pools and other surface waters (https://www.dibavod.cz/koupaci-vody)
Data analysis, data availability and user support
The strength of geographic information systems lies primarily in the variety of analytical tools that can be used to extract many insights from the data under study. Although it may not seem so at first glance, GIS and its analyses can be applied to almost any data because most of the information can be located in place or over time. Both vector (points, lines, polygons) and raster data or combinations of both can be analysed (Fig. 8). The results of the analyses cannot be of good quality unless they are based on updated and guaranteed data and are interpreted correctly. This is also a challenge for the GIS and Cartography Department that strives to ensure unified and up-to-date datasets and guaranteed data sources within and outside the Institute. Equally important is communicating with and educating project workers and researchers so that they can make sure that GIS can make their work easier, help them extract the most information from the data they explore, and visualize the results in an elegant way.
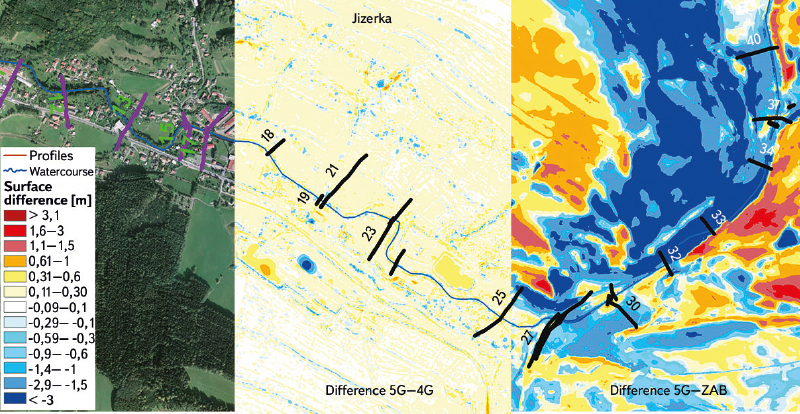
Fig. 8. Analysis of raster data in combination with vector data
WHAT TO SAY IN CONCLUSION?
As can be seen from the above (brief) overview, the scope of the GIS and Cartography Department is very broad. Through the use of GIS, geoinformatics, cartography and other similar disciplines, it implements research and commercial projects, both nationally and internationally. It is an important segment in supporting the performance of the state administration, especially the Ministry of Environment. It carries out these activities both independently, as the key research entity, and in cooperation with experts from various fields of human activity. Therefore, it has a unique opportunity to apply its knowledge and GIS in diverse and interesting projects (Fig. 9). In addition, the Department strives to provide other staff at the T. G. Masaryk Water Research Institute with a quality database, up-to-date and functional software and, above all, user support in their daily work. The work of the Department thus requires not only expertise in the software, but also knowledge of the specialised data and context. In the future, the Department would like to develop and extend these activities by using other dynamically developing analytical, visualisation and publishing tools and applications. In fact, its staff believe that GIS is not just a misunderstood expense, but above all a valuable investment with a high return.

Fig. 9. Link to the website of the GIS and Cartography Department of the T. G. Masaryk Water Research Institute
